


signal strength 1 of 5
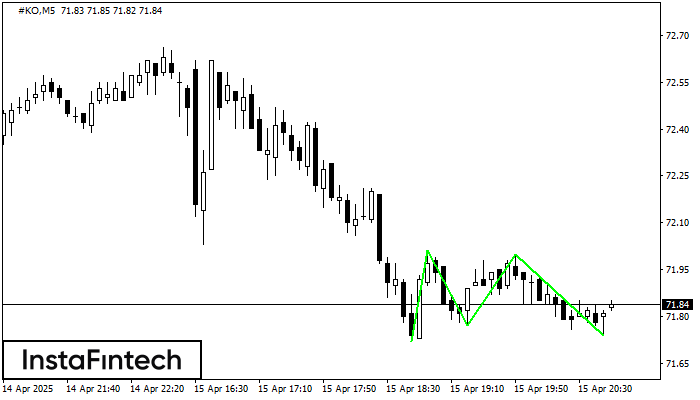
The Triple Bottom pattern has been formed on #KO M5. It has the following characteristics: resistance level 72.01/72.00; support level 71.72/71.74; the width is 29 points. In the event of a breakdown of the resistance level of 72.01, the price is likely to continue an upward movement at least to 71.92.
The M5 and M15 time frames may have more false entry points.
- All
- Double Top
- Flag
- Head and Shoulders
- Pennant
- Rectangle
- Triangle
- Triple top
- All
- #AAPL
- #AMZN
- #Bitcoin
- #EBAY
- #FB
- #GOOG
- #INTC
- #KO
- #MA
- #MCD
- #MSFT
- #NTDOY
- #PEP
- #TSLA
- #TWTR
- AUDCAD
- AUDCHF
- AUDJPY
- AUDUSD
- EURCAD
- EURCHF
- EURGBP
- EURJPY
- EURNZD
- EURRUB
- EURUSD
- GBPAUD
- GBPCHF
- GBPJPY
- GBPUSD
- GOLD
- NZDCAD
- NZDCHF
- NZDJPY
- NZDUSD
- SILVER
- USDCAD
- USDCHF
- USDJPY
- USDRUB
- All
- M5
- M15
- M30
- H1
- D1
- All
- Buy
- Sale
- All
- 1
- 2
- 3
- 4
- 5
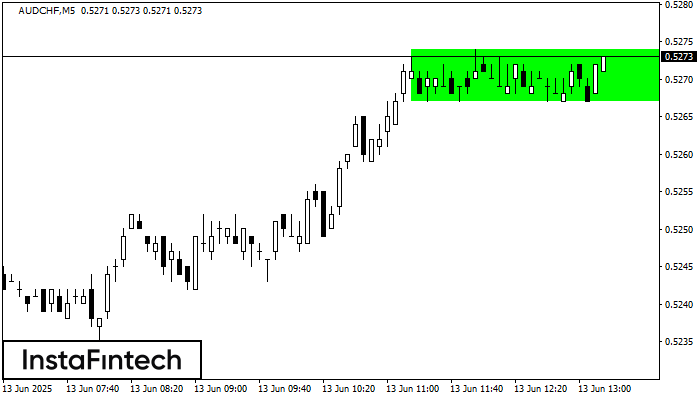
Theo biểu đồ của M5, AUDCHF đã tạo thành Hình chữ nhật tăng. Loại mô hình này cho thấy sự tiếp tục xu hướng
Khung thời gian M5 và M15 có thể có nhiều điểm vào lệnh sai hơn.
Open chart in a new window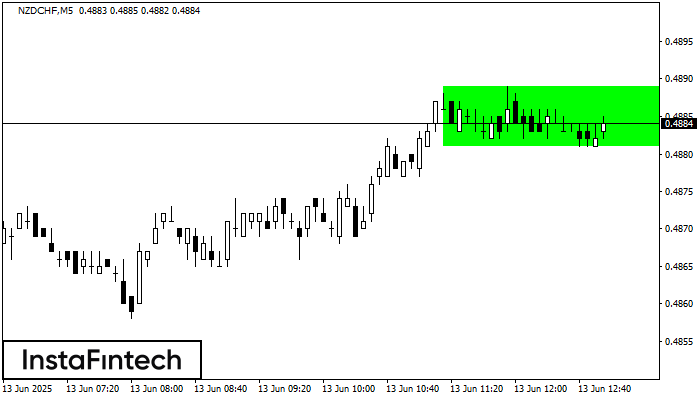
Theo biểu đồ của M5, NZDCHF đã tạo thành Hình chữ nhật tăng. Mô hình này cho thấy một sự tiếp tục xu hướng. Đường viền trên là 0.4889, đường
Khung thời gian M5 và M15 có thể có nhiều điểm vào lệnh sai hơn.
Open chart in a new window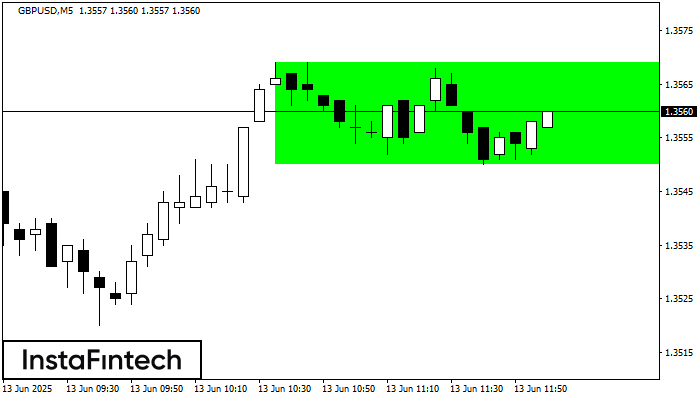
Theo biểu đồ của M5, GBPUSD đã tạo thành Hình chữ nhật tăng. Loại mô hình này cho thấy sự tiếp tục xu hướng
Khung thời gian M5 và M15 có thể có nhiều điểm vào lệnh sai hơn.
Open chart in a new window


