

signal strength 1 of 5

The Triple Bottom pattern has been formed on GOLD M5. It has the following characteristics: resistance level 3009.08/2992.38; support level 2976.74/2972.63; the width is 3234 points. In the event of a breakdown of the resistance level of 3009.08, the price is likely to continue an upward movement at least to 2971.02.
The M5 and M15 time frames may have more false entry points.
Xem thêm
- All
- Double Top
- Flag
- Head and Shoulders
- Pennant
- Rectangle
- Triangle
- Triple top
- All
- #AAPL
- #AMZN
- #Bitcoin
- #EBAY
- #FB
- #GOOG
- #INTC
- #KO
- #MA
- #MCD
- #MSFT
- #NTDOY
- #PEP
- #TSLA
- #TWTR
- AUDCAD
- AUDCHF
- AUDJPY
- AUDUSD
- EURCAD
- EURCHF
- EURGBP
- EURJPY
- EURNZD
- EURRUB
- EURUSD
- GBPAUD
- GBPCHF
- GBPJPY
- GBPUSD
- GOLD
- NZDCAD
- NZDCHF
- NZDJPY
- NZDUSD
- SILVER
- USDCAD
- USDCHF
- USDJPY
- USDRUB
- All
- M5
- M15
- M30
- H1
- D1
- All
- Buy
- Sale
- All
- 1
- 2
- 3
- 4
- 5
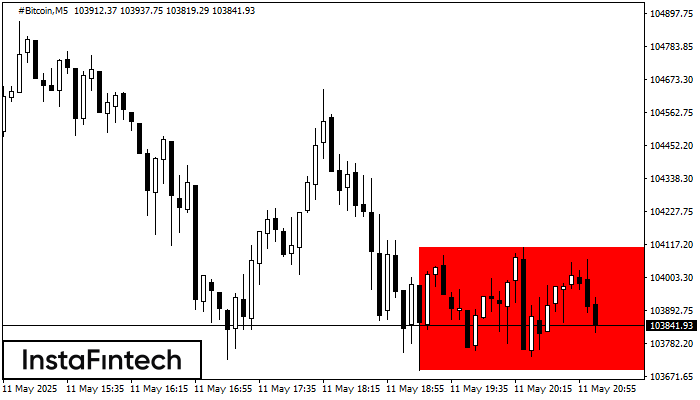
According to the chart of M5, #Bitcoin formed the Bearish Rectangle which is a pattern of a trend continuation. The pattern is contained within the following borders: lower border 103691.15
The M5 and M15 time frames may have more false entry points.
Open chart in a new window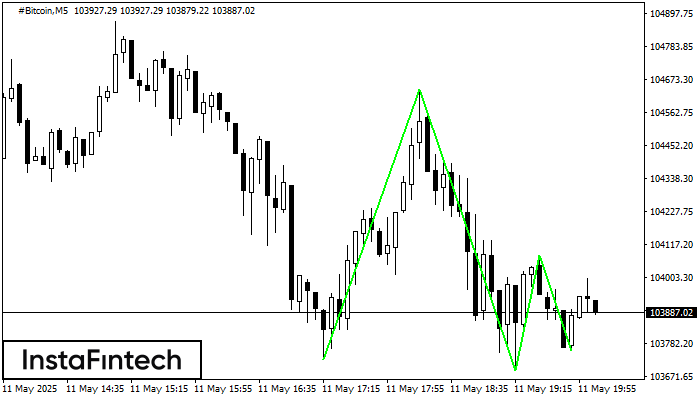
The Triple Bottom pattern has formed on the chart of #Bitcoin M5. Features of the pattern: The lower line of the pattern has coordinates 104640.24 with the upper limit 104640.24/104078.48
The M5 and M15 time frames may have more false entry points.
Open chart in a new window
The Double Bottom pattern has been formed on #Bitcoin M5; the upper boundary is 104640.24; the lower boundary is 103691.15. The width of the pattern is 91343 points. In case
The M5 and M15 time frames may have more false entry points.
Open chart in a new window


