

сила сигнала 1 из 5
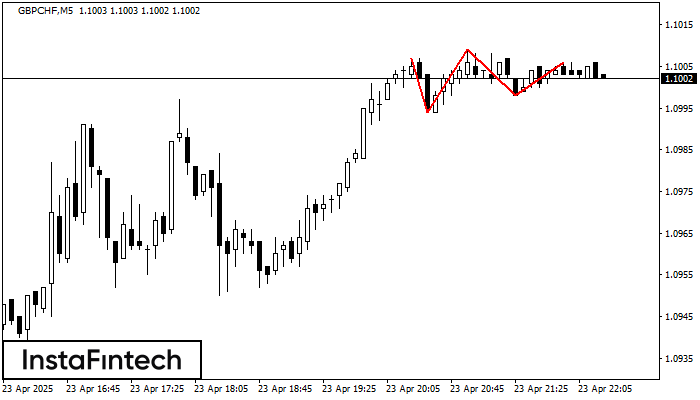
На графике GBPCHF M5 образовалась фигура «Тройная вершина». Данная фигура относится к типу разворотных и имеет характеристику: Верхняя граница 1.1007/1.1006; Нижняя граница 1.0994/1.0998; Ширина фигуры 11 пунктов. Прогноз: В случае пробоя нижней границы 1.0994 вероятно дальнейшее нисходящее движение к уровню 1.0994.
Таймфреймы М5 и М15 могут иметь больше ложных точек входа.
Дивіться також
- Все
- Вымпел
- Голова и плечи
- Двойная вершина
- Прямоугольник
- Треугольник
- Тройная вершина
- Флаг
- Все
- #AAPL
- #AMZN
- #Bitcoin
- #EBAY
- #FB
- #GOOG
- #INTC
- #KO
- #MA
- #MCD
- #MSFT
- #NTDOY
- #PEP
- #TSLA
- #TWTR
- AUDCAD
- AUDCHF
- AUDJPY
- AUDUSD
- EURCAD
- EURCHF
- EURGBP
- EURJPY
- EURNZD
- EURRUB
- EURUSD
- GBPAUD
- GBPCHF
- GBPJPY
- GBPUSD
- GOLD
- NZDCAD
- NZDCHF
- NZDJPY
- NZDUSD
- SILVER
- USDCAD
- USDCHF
- USDJPY
- USDRUB
- Все
- M5
- M15
- M30
- H1
- D1
- Все
- Покупка
- Продажа
- Все
- 1
- 2
- 3
- 4
- 5
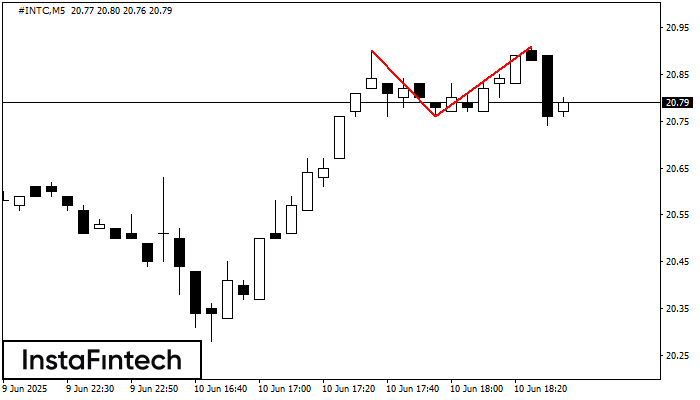
On the chart of #INTC M5 the Double Top reversal pattern has been formed. Characteristics: the upper boundary 20.91; the lower boundary 20.76; the width of the pattern 15 points
The M5 and M15 time frames may have more false entry points.
Open chart in a new window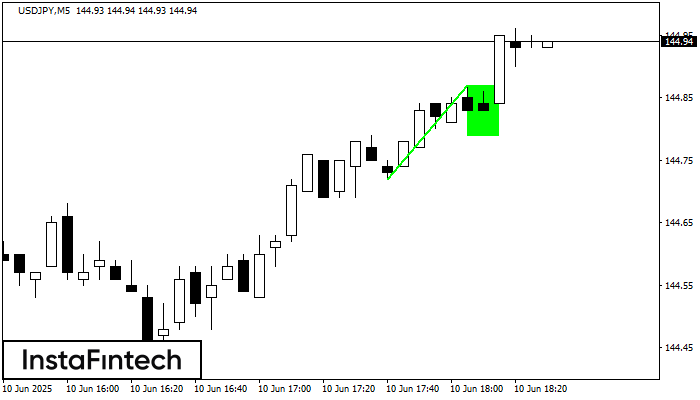
The Bullish Flag pattern which signals continuation of a trend has been formed on the chart USDJPY M5. Forecast: if the price breaks above the pattern high at 144.87, then
The M5 and M15 time frames may have more false entry points.
Open chart in a new window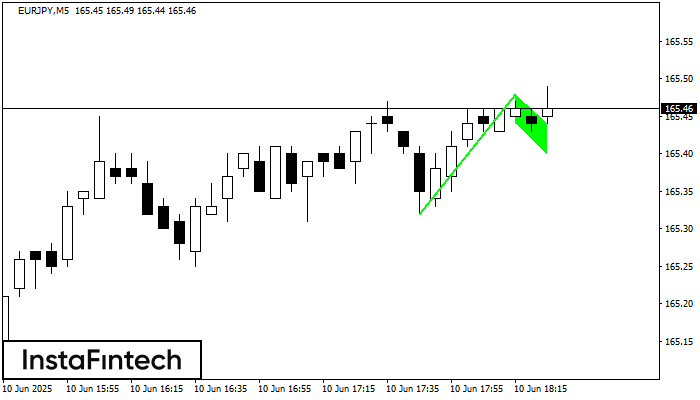
The Bullish Flag pattern has been formed on EURJPY at M5. The lower boundary of the pattern is located at 165.44/165.40, while the higher boundary lies at 165.48/165.44. The projection
The M5 and M15 time frames may have more false entry points.
Open chart in a new window


