


signal strength 3 of 5
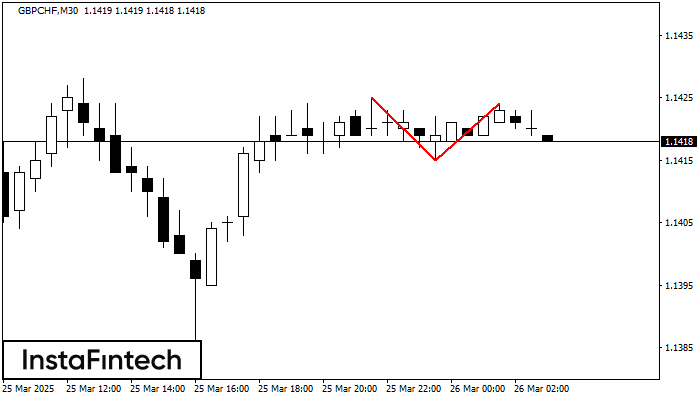
The Double Top reversal pattern has been formed on GBPCHF M30. Characteristics: the upper boundary 1.1425; the lower boundary 1.1415; the width of the pattern is 9 points. Sell trades are better to be opened below the lower boundary 1.1415 with a possible movements towards the 1.1385 level.
- All
- Double Top
- Flag
- Head and Shoulders
- Pennant
- Rectangle
- Triangle
- Triple top
- All
- #AAPL
- #AMZN
- #Bitcoin
- #EBAY
- #FB
- #GOOG
- #INTC
- #KO
- #MA
- #MCD
- #MSFT
- #NTDOY
- #PEP
- #TSLA
- #TWTR
- AUDCAD
- AUDCHF
- AUDJPY
- AUDUSD
- EURCAD
- EURCHF
- EURGBP
- EURJPY
- EURNZD
- EURRUB
- EURUSD
- GBPAUD
- GBPCHF
- GBPJPY
- GBPUSD
- GOLD
- NZDCAD
- NZDCHF
- NZDJPY
- NZDUSD
- SILVER
- USDCAD
- USDCHF
- USDJPY
- USDRUB
- All
- M5
- M15
- M30
- H1
- D1
- All
- Buy
- Sale
- All
- 1
- 2
- 3
- 4
- 5
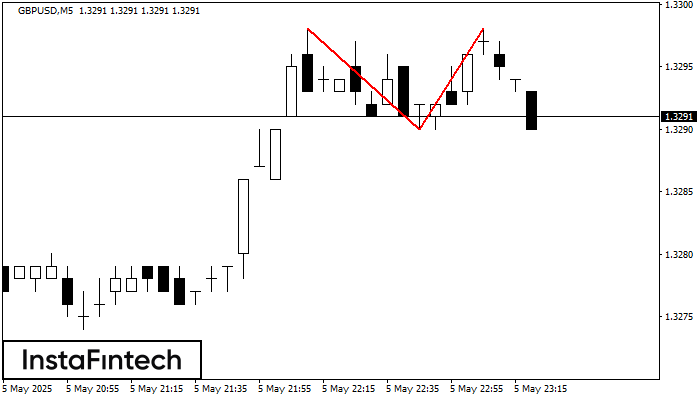
รูปแบบการย้อนตัว รูปแบบกราฟจุดสองยอด (Double Top) ได้ถูกสร้างขึ้นมาใน GBPUSD M5 คุณลักษณะ: ขอบเขตด้านบน 1.3298; ขอบเขตด้านล่าง 1.3290; ความกว้างของกราฟรูปแบบนี้คือ 8 จุด
ขอบเตระยะเวลาใน M5 และ M15 อาจจะมีตำแหน่งการเข้าใช้งานที่ผิดพลาดมากยิ่งขึ้น
Open chart in a new windowwas formed on 05.05 at 22:24:12 (UTC+0)
signal strength 1 of 5
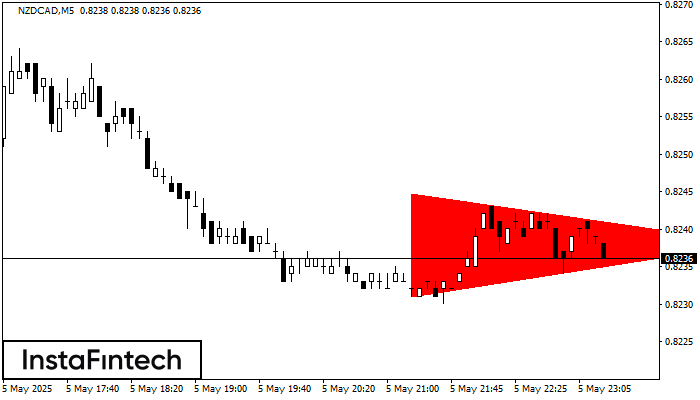
อ้างอิงจากชาร์ตของ M5, NZDCAD ที่ได้สร้างรูปแบบ รูปแบบสามเหลี่ยมสมมาตรขาลง (Bearish Symmetrical Triangle) ออกมา รูปแบบนี้แสดงถึงแนวโน้มขาลงที่เกิดขึ้นต่อไป ในกรณีที่ขอบเขตด้านล่าง 0.8231 จะมีการเคลื่อนตัวทะลุผ่าน4f ส่วนนี้ เป็นผลกำไรที่คาดการณ์ไว้
ขอบเตระยะเวลาใน M5 และ M15 อาจจะมีตำแหน่งการเข้าใช้งานที่ผิดพลาดมากยิ่งขึ้น
Open chart in a new windowwas formed on 05.05 at 21:40:10 (UTC+0)
signal strength 1 of 5
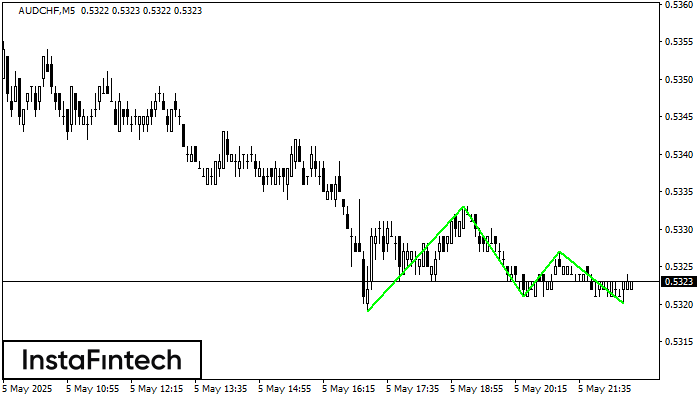
รูปแบบ รูปแบบกราฟจุดสามยอดขาลง (Triple Bottom) ได้สร้างขึ้นมาในชาร์ตของ AUDCHF M5 ลักษณะของกราฟรูปแบบนี้: เส้นด้านล่างของกราฟรูปแบบนี้มีพิกัดอยู่ที่ 0.5333 พร้อมกับลิมิตด้านบน 0.5333/0.5327,ระยะของความกว้างคือ 14 จุด การก่อตัวของกราฟรูปแบบ
ขอบเตระยะเวลาใน M5 และ M15 อาจจะมีตำแหน่งการเข้าใช้งานที่ผิดพลาดมากยิ่งขึ้น
Open chart in a new window


