empty
04.12.2023 10:23 AM
Weekly forecast for simplified wave analysis of GBP/USD, AUD/USD, USD/CHF, EUR/JPY, EUR/CHF, and US dollar index from December 4th

GBP/USD

Brief Analysis:

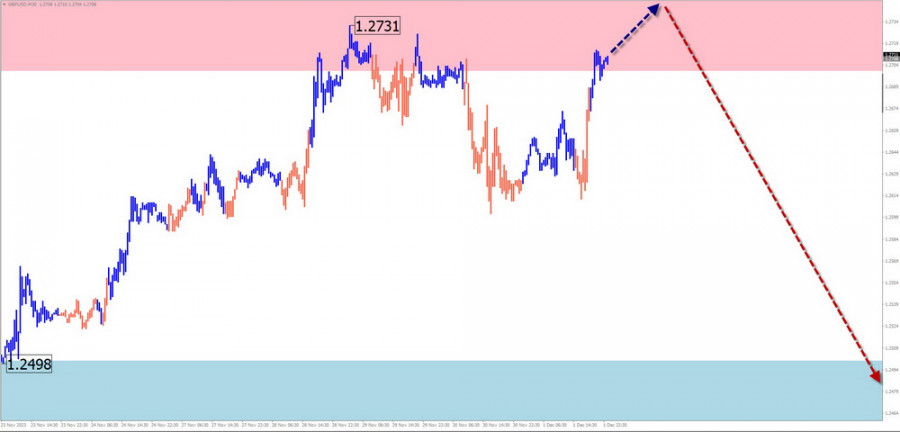
The ascending wave has defined the major trend of the British pound since the beginning of October. The wave level of the current segment allows classifying its scale as a daily time frame (TF). Quotes are at the lower edge of a wide potential reversal zone. Immediate signals for a change in direction are not observed on the chart.

Week Forecast:

At the beginning of the upcoming week, there is a high probability of a "sideways" movement along the levels of the calculated resistance zone. A short-term breakthrough of its upper boundary is not ruled out. An increase in volatility, a reversal, and the beginning of a downward movement in the pound's price can be expected by the end of the week.

This image is no longer relevant

Potential Reversal Zones

Resistance:

  • 1.2700/1.2750

Support:

  • 1.2500/1.2450

Recommendations

Buying: Lack of potential and may lead to losses.

Selling: After reversal signals in the resistance area appear, they can be used for short-term fractional deals.

AUD/USD

Brief Analysis:

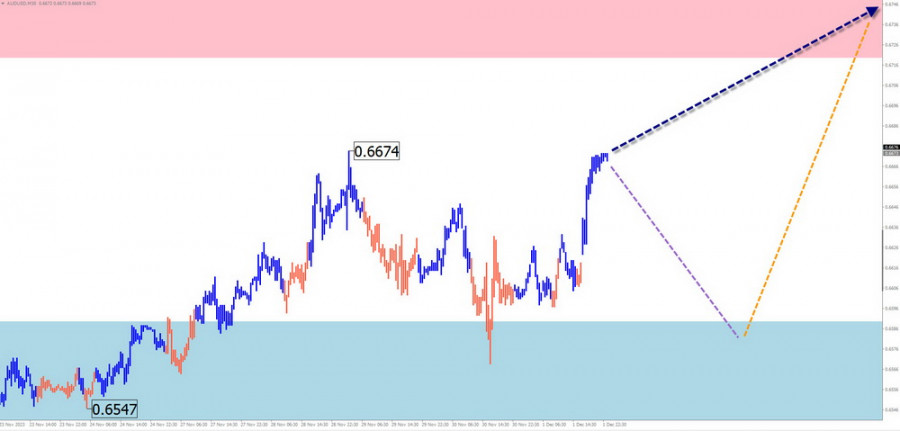
The weekly chart scale of the main pair of the Australian Dollar indicates the dominance of a descending trend. The ascending segment that started in mid-October forms a correction to the last trending segment. The structure of this movement is not complete at the time of the analysis. The price is approaching the lower boundary of the preliminary target zone.

Week Forecast:

Over the upcoming week, a gradual movement of the pair's quotes towards the calculated resistance zone is expected. The nature of oscillations is expected to be flat. A short-term decrease beyond the support zone is included in the next few days. An active growth phase is closer to the weekend.

This image is no longer relevant

Potential Reversal Zones

Resistance:

  • 0.6720/0.6770

Support:

  • 0.6590/0.6540

Recommendations

Selling: Premature until the current wave is completed.

Buying: This can be recommended with a reduced lot from the support zone after corresponding signals from your trading system (TS) appear. The resistance zone limits the potential.

USD/CHF

Brief Analysis:

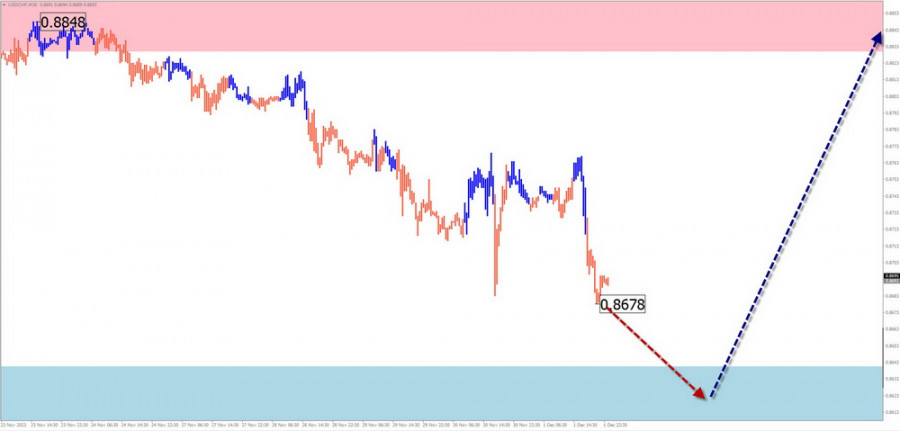
Today's unfinished wave structure resembles a flat plane and has been reported since mid-July. The structure of the wave develops in the middle part (B). This segment looks complete, but signals of an imminent change in direction are not observed on the chart.

Week Forecast:

A reversal and the beginning of a price rise can be expected after the likely pressure on the support zone on the pair's chart. The price increase is possible up to the calculated resistance. Its boundary passes along the upper edge of the preliminary target zone of the entire current wave.

This image is no longer relevant

Potential Reversal Zones

Resistance:

  • 0.8830/0.8880

Support:

  • 0.8640/0.8590

Recommendations

Selling: No conditions for such deals in the coming days.

Buying: After corresponding signals from your TS appear, they can be used for trading deals. The nearest support limits the potential.

EUR/JPY

Brief Analysis:

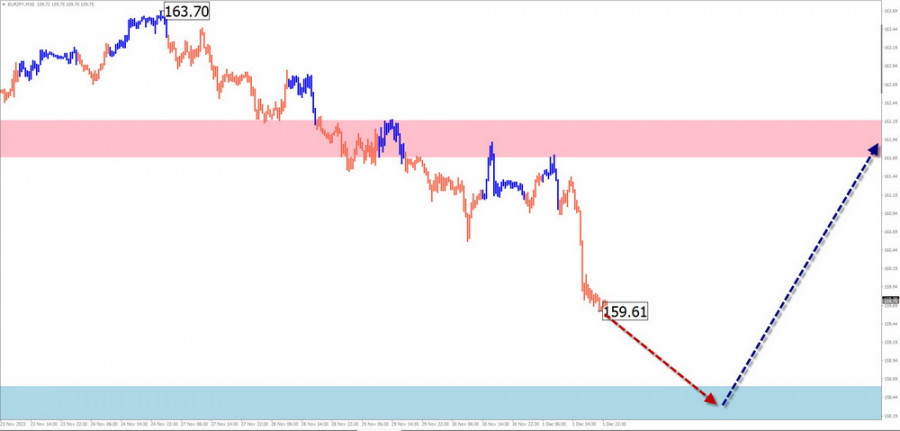
Today's unfinished wave structure of the Euro/Yen chart is ascending, starting from July 28th. The descending correction that started in mid-November exceeded the rollback level of the last segment and continued its development. Quotes are approaching the upper boundary of a powerful potential reversal zone. Signals of an imminent change in direction are not observed.

Week Forecast:

In the next few days, a gradual decrease in the cross's price is expected up to the boundaries of the calculated support. After that, the formation of a reversal and the resumption of the bullish mood of the movement can be expected. The highest activity is likely closer to the weekend.

This image is no longer relevant

Potential Reversal Zones

Resistance:

  • 161.70/162.20

Support:

  • 158.60/158.10

Recommendations

Buying: Premature until the current wave is complete.

Selling: Can be used with a fractional lot within individual sessions. It is recommended to close deals at the first signs of a reversal.

EUR/CHF

Brief Analysis:

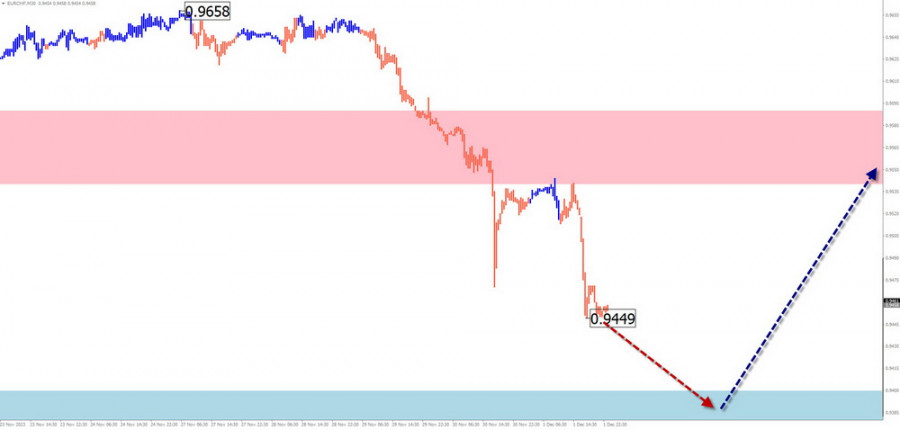
The short-term trend of the Euro/Swiss Franc cross since January of this year is directed downward. As of today, the latest trending segment reports, which are still unfinished, date back to November 20th. Its structure at the time of the analysis does not show completeness.

Week Forecast:

In the next couple of days, the price will continue to move down to the contact with the support zone. Further, the formation of a reversal and the beginning of a bullish mood of the cross can be expected. The resistance zone demonstrates the upper boundary of the maximum possible weekly movement of the pair.

This image is no longer relevant

Potential Reversal Zones

Resistance:

  • 0.9540/0.9590

Support:

  • 0.9400/0.9350

Recommendations

Buying: This will become relevant for trading after the appearance of reversal signals on your TS.

Selling: Possible with a fractional lot within individual sessions. They have limited potential.

US dollar index

Brief Analysis:

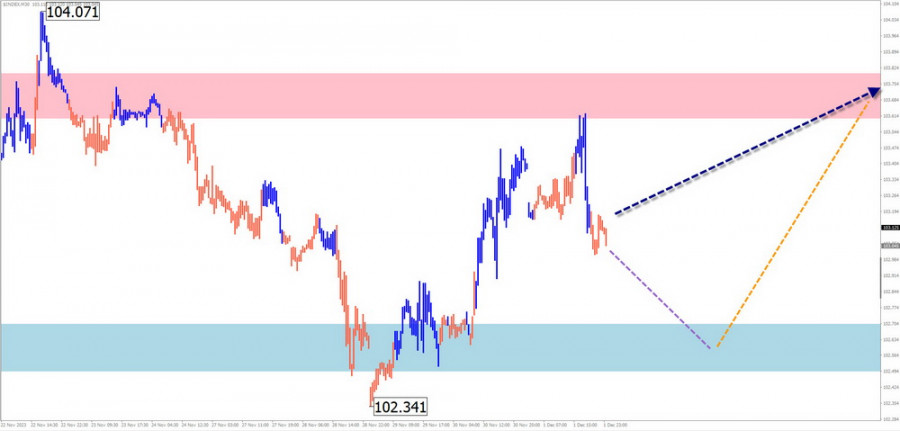
The daily scale of the US dollar index demonstrates a descending wave from October 3rd, which still needs to be completed. In the last decade, index quotes on the chart form an elongated horizontal plane.

Week Forecast:

A slight decrease in the US Dollar rate against other world currencies can be expected in the upcoming week. The trend is temporary since the calculated support limits the downward movement range. Further, an increase in dollar values is expected, not exceeding the resistance.

This image is no longer relevant

Potential Reversal Zones

Resistance:

  • 103.60/105.80

Support:

  • 102.70/102.50

Recommendations

There are no conditions for selling national currencies in the upcoming week. In the next couple of days, transactions on the

strengthening of other currencies against the US dollar may be profitable.

Notes: In simplified wave analysis (SWA), all waves consist of 3 parts (A-B-C). The analysis focuses on the last unfinished wave on each TF. Dashed lines indicate expected movements.

Attention: The wave algorithm does not consider the duration of instrument movements in time!

Summary
Urgency
Analytic
Vyacheslav Ognev
Start trade
รับผลกำไรจากการเปลี่ยนแปลงอัตราสกุลเงินดิจิทัลกับ InstaForex.
ดาวน์โหลด MetaTrader 4 และเปิดการซื้อขายครั้งแรกของคุณ.
  • Grand Choice
    Contest by
    InstaForex
    InstaForex always strives to help you
    fulfill your biggest dreams.
    เข้าร่วมการแข่งขัน


บทความแนะนำ

การวิเคราะห์ GBP/USD เมื่อวันที่ 24 กรกฎาคม 2025

รูปแบบคลื่นสำหรับคู่ GBP/USD ยังคงแสดงถึงการก่อตัวของรูปแบบคลื่นที่เป็นคลื่นขาขึ้น รูปภาพของคลื่นเกือบจะเหมือนกับ EUR/USD เนื่องจากค่าเงินดอลลาร์สหรัฐยังคงเป็นตัวขับเคลื่อนหลักของแนวโน้มตลาดในปัจจุบัน ความต้องการใช้ดอลลาร์ลดลงทั่วกระดาน ทำให้เครื่องมือหลายตัวแสดงพฤติกรรมแบบเดียวกัน คลื่น 2 ของแนวโน้มขาขึ้นมีลักษณะเป็นคลื่นเดียว คลื่นที่ 3 ที่คาดการณ์ไว้มีความสมบูรณ์และน่าเชื่อถือ ดังนั้นฉันคาดการณ์ถึงการก่อตัวของโครงสร้างการปรับฐาน

Chin Zhao 20:17 2025-07-24 UTC+2

การวิเคราะห์ EUR/USD ประจำวันที่ 24 กรกฎาคม 2025

รูปแบบคลื่นบนกราฟ EUR/USD ราย 4 ชั่วโมงยังคงไม่เปลี่ยนแปลงเป็นเวลาหลายเดือน ส่วนขาขึ้นของแนวโน้มยังคงพัฒนา และข่าวส่วนใหญ่ยังคงสนับสนุนทุกค่าเงินยกเว้นดอลลาร์สหรัฐ สงครามการค้าที่ย่อมเล็กได้โดย Donald Trump ถูกตั้งใจให้นำไปสู่รายได้งบประมาณที่เพิ่มสูงขึ้นและกำจัดการขาดดุลในการค้า อย่างไรก็ตาม เป้าหมายเหล่านี้ยังไม่ประสบความสำเร็จ การเจรจาการค้ามีความยากลำบาก และกฎหมาย

Chin Zhao 20:00 2025-07-24 UTC+2

การวิเคราะห์ GBP/USD ณ วันที่ 23 กรกฎาคม 2025

รูปแบบคลื่นสำหรับ GBP/USD ยังคงบ่งชี้ถึงการก่อตัวของโครงสร้างคลื่นขาขึ้นที่มีแรงกระทบ คลื่นภาพมีลักษณะเกือบเหมือนกันกับ EUR/USD เพราะว่าดอลลาร์สหรัฐยังคงเป็นปัจจัยเดียวที่ขับเคลื่อนตลาด ความต้องการสำหรับดอลลาร์กำลังลดลงทั่วทุกฝ่าย ทำให้เครื่องมือหลายตัวมีพฤติกรรมคล้ายคลึงกัน คลื่นที่ 2 ของช่วงแนวโน้มขาขึ้นได้นำเสนอในรูปแบบของคลื่นเดี่ยว คลื่นที่ 3 ที่สมมุติดูแข็งแกร่งและสมบูรณ์ ดังนั้นฉันคาดว่าจะมีการก่อตัวของโครงสร้างที่ต้องแก้ไขอยู่

Chin Zhao 20:25 2025-07-23 UTC+2

การวิเคราะห์อัตราแลกเปลี่ยน EUR/USD ประจำวันที่ 23 กรกฎาคม 2025

รูปแบบของคลื่นสำหรับ GBP/USD ยังคงบ่งชี้ถึงการก่อตัวของโครงสร้างคลื่นพุ่ง. ภาพคลื่นนั้นเกือบจะเหมือนกับของ EUR/USD เนื่องจากดอลลาร์สหรัฐยังคงเป็นปัจจัยเดียวที่ขับเคลื่อนตลาด. ความต้องการดอลลาร์สหรัฐลดลงในทุกทิศทาง ทำให้เครื่องมือทางการเงินหลายรายการแสดงความเคลื่อนไหวที่คล้ายกัน. คลื่นที่ 2 ของช่วงแนวโน้มขาขึ้นได้อยู่ในรูปของคลื่นเดี่ยว. คลื่นที่ 3 ที่คาดการณ์ไว้ดูแข็งแกร่งและสมบูรณ์ ฉะนั้นฉันจึงคาดว่าจะมีการก่อตัวของโครงสร้างปรับตัว

Chin Zhao 20:17 2025-07-23 UTC+2

การวิเคราะห์ GBP/USD ประจำวันที่ 22 กรกฎาคม 2025

รูปแบบคลื่นสำหรับ GBP/USD ยังคงบ่งบอกถึงการสร้างโครงสร้างคลื่นแรงซื้อที่กำลังเกิดขึ้น รูปแบบคลื่นนี้แทบจะเหมือนกับ EUR/USD เนื่องจากดอลลาร์สหรัฐยังคงเป็นแรงขับเคลื่อนหลักของแนวโน้มตลาดในปัจจุบัน อุปสงค์สำหรับดอลลาร์กำลังอ่อนตัวลงทั่วกระดาน ซึ่งเป็นเหตุผลว่าทำไมนวัตกรรมหลายตัวแสดงพฤติกรรมที่คล้ายคลึงกัน คลื่นที่ 2 ของส่วนแนวโน้มขึ้นได้มีรูปแบบเป็นคลื่นเดี่ยว คลื่นที่ 3 ที่คาดว่าเกิดขึ้นดูแข็งแกร่งและสมบูรณ์ ดังนั้นคาดว่าจะมีโครงสร้างการปรับฐานเกิดขึ้น

Chin Zhao 20:26 2025-07-22 UTC+2

การวิเคราะห์ EUR/USD วันที่ 22 กรกฎาคม 2025

รูปแบบคลื่นในแผนภูมิ EUR/USD แบบ 4 ชั่วโมงยังคงไม่เปลี่ยนแปลงมาเป็นเวลาหลายเดือนติดต่อกันแล้ว การก่อรูปของทิศทางขาขึ้นยังคงดำเนินต่อไป ในขณะที่ข่าวยังคงสนับสนุนสกุลเงินทั้งหมด ยกเว้นดอลลาร์สหรัฐ สงครามการค้าที่ Donald Trump เริ่มต้นขึ้นมีจุดประสงค์เพื่อเพิ่มรายได้ของงบประมาณและกำจัดการขาดดุลการค้า อย่างไรก็ตาม เป้าหมายเหล่านี้ยังไม่ประสบผลสำเร็จ—การทำข้อตกลงการค้าถูกลงนามด้วยความยากลำบาก

Chin Zhao 20:23 2025-07-22 UTC+2

วิเคราะห์ GBP/USD ประจำวันที่ 21 กรกฎาคม 2025

รูปแบบคลื่นของคู่เงิน GBP/USD ยังคงบ่งบอกถึงการก่อตัวของรูปแบบคลื่นกระตุ้นแบบขาขึ้น รูปแบบคลื่นนี้คล้ายกับของคู่เงิน EUR/USD เนื่องจากดอลลาร์สหรัฐเป็นตัวขับเคลื่อนหลักที่อยู่เบื้องหลังการเคลื่อนไหวของตลาดในปัจจุบัน ความต้องการสำหรับดอลลาร์สหรัฐกำลังลดลงทั่วทุกภาคส่วน ซึ่งทำให้เครื่องมือหลายชนิดแสดงพลวัตที่คล้ายกัน คลื่นที่ 2 ของเซกเมนต์แนวโน้มขาขึ้นได้เกิดขึ้นในรูปของคลื่นเดียว คลื่นที่ 3 ที่คาดว่าจะเพิ่มขึ้นได้พัฒนากลายเป็นรูปแบบที่น่าเชื่อถือและสมบูรณ์ ดังนั้นฉันคาดหวังว่าจะมีการสร้างโครงสร้างการแก้ไข

Chin Zhao 20:14 2025-07-21 UTC+2

การวิเคราะห์ EUR/USD วันที่ 21 กรกฎาคม 2025

ลวดลายคลื่นบนกราฟ 4 ชั่วโมงของ EUR/USD ยังคงไม่เปลี่ยนแปลงเป็นเวลาหลายเดือน การก่อตัวของช่วงแนวโน้มขาขึ้นยังคงดำเนินต่อไป โดยได้รับการสนับสนุนจากข่าวภูมิหลังที่เป็นประโยชน์ต่อทุกสกุลเงินยกเว้นดอลลาร์ สงครามการค้าที่ยิงโดย Donald Trump มีจุดประสงค์เพื่อเพิ่มรายได้งบประมาณและกำจัดการขาดดุลการค้า อย่างไรก็ตาม, เป้าหมายเหล่านี้ยังไม่บรรลุ; ข้อตกลงการค้ามีการลงนามด้วยความยากลำบาก

Chin Zhao 20:06 2025-07-21 UTC+2

การพยากรณ์รายสัปดาห์โดยใช้การวิเคราะห์คลื่นแบบง่ายสำหรับ GBP/USD, AUD/USD, USD/CHF, EUR/JPY, AUD/JPY และดัชนีดอลลาร์สหรัฐ – 21 กรกฎาคม

GBP/USD การวิเคราะห์: เงินปอนด์อังกฤษยังคงเคลื่อนไหวในแนวโน้มขาลงซึ่งเริ่มขึ้นเมื่อเดือนที่แล้ว หลังจากที่ทำลายระดับแนวรับสำคัญระดับกลางเมื่อสัปดาห์ที่ผ่านมา คู่เงินนี้ก็ฟื้นตัวกลับมาเกิดการปรับฐานตามแนวระดับนั้น โครงสร้างของคลื่นชี้ให้เห็นว่าส่วนสุดท้าย (C) ยังขาดหายไป การคาดการณ์: แนวโน้มข้างเหลี่ยมคาดว่าจะเกิดขึ้นในสัปดาห์ที่จะถึงนี้ภายในกรอบแนวต้านใกล้เคียง การเคลื่อนไหวขึ้นมีแนวโน้มเกิดขึ้นในช่วงต้นสัปดาห์มากกว่า การพลิกกลับและการกลับมาของแนวโน้มขาลงไปยังโซนแนวรับคาดว่าจะเกิดขึ้นใกล้กับพื้นที่แนวต้านที่คำนวณไว้ โซนที่มีความเป็นไปได้ในการกลับตัว แนวต้าน: 1.3460/1.3510

Isabel Clark 11:22 2025-07-21 UTC+2

การพยากรณ์รายสัปดาห์โดยการวิเคราะห์คลื่นที่ง่ายสำหรับ EUR/USD, USD/JPY, GBP/JPY, USD/CAD, NZD/USD, และ GOLD – วันที่ 21 กรกฎาคม

EUR/USD การวิเคราะห์: แนวโน้มขาขึ้นของคู่เงินยูโรหลักที่เริ่มต้นในเดือนกุมภาพันธ์ปีนี้ได้นำราคามาถึงขอบเขตล่างของโซนกลับตัวที่กว้างในกรอบเวลารายสัปดาห์ ตั้งแต่กลางเดือนที่แล้ว การเคลื่อนไหวของราคาเป็นส่วนใหญ่ในลักษณะด้านข้างตามแนวขอบเขตล่าง การแก้ไขการเคลื่อนไหวตรงข้ามกับส่วนแนวโน้มล่าสุดกำลังเกิดขึ้นภายในโครงสร้างคลื่น การคาดการณ์: คาดว่าการเคลื่อนไหวด้านข้างโดยรวมจะยังคงอยู่ต่อไปในอีกไม่กี่วันข้างหน้า โดยอยู่ภายในช่องราคาระหว่างโซนเคลื่อนไหวตรงข้ามที่ใกล้ที่สุด มีความเป็นไปได้ที่จะมีการเคลื่อนไหวขึ้นแบบเรียบในช่วงครึ่งแรกของสัปดาห์ โดยอาจไปถึงโซนแนวต้าน และมีการกลับมาของการเคลื่อนไหวลงในช่วงปลายสัปดาห์ โซนที่อาจมีการกลับตัว แนวต้าน: 1.1690/1.1740

Isabel Clark 11:05 2025-07-21 UTC+2
หากไม่สะดวกคุยในตอนนี้
ระบุคำถามไว้ได้ใน แชท.
Widget callback
 

Dear visitor,

Your IP address shows that you are currently located in the USA. If you are a resident of the United States, you are prohibited from using the services of InstaFintech Group including online trading, online transfers, deposit/withdrawal of funds, etc.

If you think you are seeing this message by mistake and your location is not the US, kindly proceed to the website. Otherwise, you must leave the website in order to comply with government restrictions.

Why does your IP address show your location as the USA?

  • - you are using a VPN provided by a hosting company based in the United States;
  • - your IP does not have proper WHOIS records;
  • - an error occurred in the WHOIS geolocation database.

Please confirm whether you are a US resident or not by clicking the relevant button below. If you choose the wrong option, being a US resident, you will not be able to open an account with InstaForex anyway.

We are sorry for any inconvenience caused by this message.