empty
23.10.2023 10:53 AM
Weekly forecast based on simplified wave analysis: GBP/USD, AUD/USD, USD/CHF, EUR/JPY, EUR/CHF, and US dollar index on October 23rd

GBP/USD

Brief Analysis:

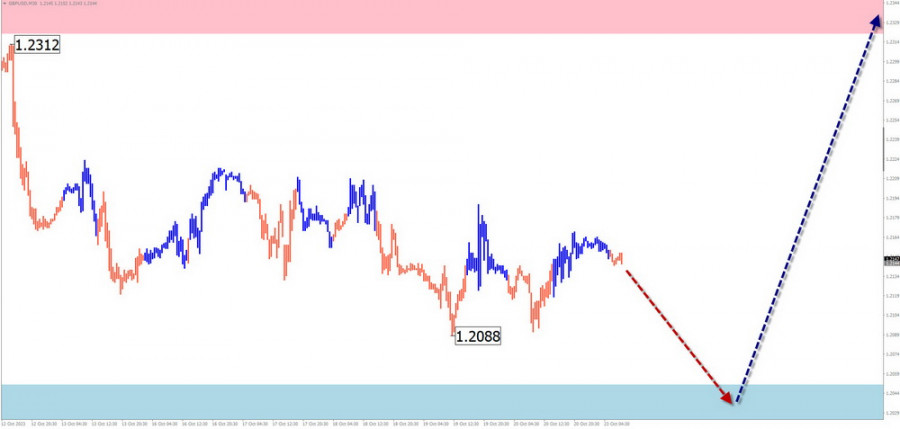
On the British pound chart, a large-scale descending wave has been forming since the beginning of September. Throughout October, a complex corrective pattern in the form of a shifting flat structure has been developing within the wave. At the time of the analysis, it did not show signs of completion. The price is near the lower boundary of a strong potential reversal zone in the weekly time frame.

Weekly Forecast:

At the beginning of the upcoming week, the completion of the price decrease of the British pound is expected, down to the support zone. Following that, a reversal formation and the beginning of a price increase can be anticipated. The resistance zone demonstrates the most probable level of the week's pair trajectory completion.

This image is no longer relevant

Potential Reversal Zones

Resistance:

  • 1.2320/1.2370

Support:

  • 1.2050/1.2000

Recommendations:

Purchases: This will become possible with a fractional lot size after the appearance of corresponding reversal signals in the support area.

Sales: Have limited potential. It is recommended to reduce the lot size and close deals at the first reversal signals.

AUD/USD

Brief Analysis:

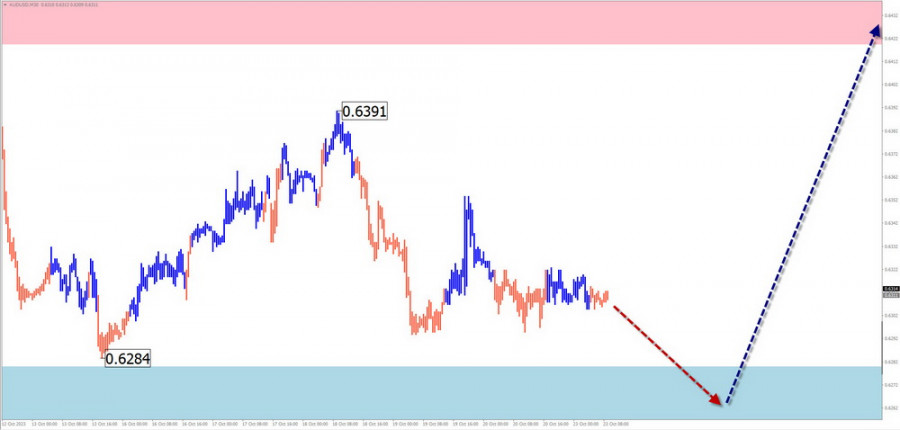
A descending trend continues on the main Australian dollar pair's chart. An unfinished segment started on August 11. Within its structure, the current month has seen a counter-correction in the form of an elongated flat. This wave segment is in its final phase.

Weekly Forecast:

At the beginning of the upcoming week, a movement along the upper boundary of the support is expected. Subsequently, a reversal and the resumption of price increases can be expected. Its completion is most likely within the boundaries of the resistance zone.

This image is no longer relevant

Potential Reversal Zones

Resistance:

  • 0.6420/0.6470

Support:

  • 0.6280/0.6230

Recommendations:

Sales: are quite risky and are not recommended in the coming days.

Purchases: will become possible after the appearance of reversal signals in the support area, according to your trading system.

USD/CHF

Brief Analysis:

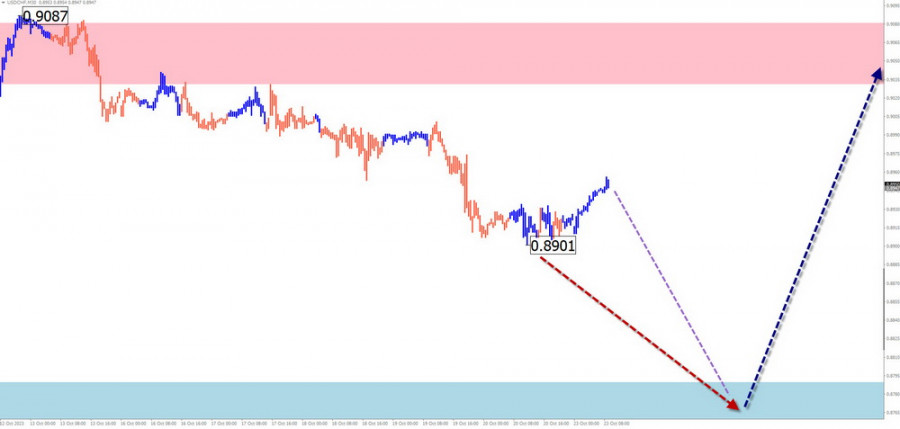
An unfinished bearish wave on the major Swiss Franc chart has been counting since the beginning of November last year. Since a powerful support level in mid-July, the price has been forming a correctional zigzag. At the time of the analysis, the middle part of the wave construction is unfolding.

Weekly Forecast:

A downward trajectory is likely in the next couple of days. Subsequently, an activation and resumption of the upward trajectory are to be expected. The upper boundary of the expected weekly pair trajectory is represented by the calculated resistance.

This image is no longer relevant

Potential Reversal Zones

Resistance:

  • 0.9030/0.9060

Support:

  • 0.8790/0.8740

Recommendations

Sales: Can be used with a fractional lot size for intraday trading in the coming days.

Purchases: will become relevant after the appearance of corresponding signals in the support zone.

EUR/JPY

Brief Analysis:

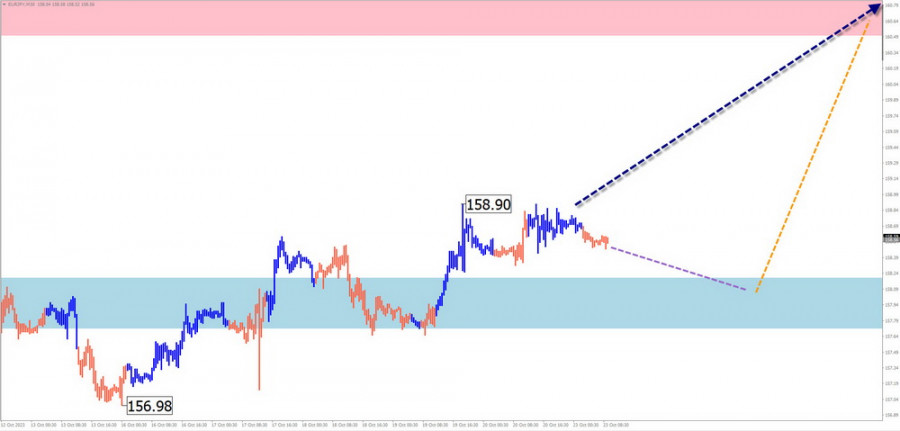
Since March of this year, an ascending wave has determined the main direction of the euro against the Japanese yen. An unfinished segment started on September 26. Over the past two weeks, the price has broken through a strong resistance level and has subsequently relied on it as support. Within this zone, the middle part of the short-term wave (B) has been forming.

Weekly Forecast:

In the next few days, there is a probability of a sideways movement along the support levels. Closer to the weekend, an increase in volatility, a reversal, and a return to the main course of movement can be expected.

This image is no longer relevant

Potential Reversal Zones

Resistance:

  • 160.50/161.00

Support:

  • 158.20/157.70

Recommendations

Sales: highly risky and may lead to losses.

Purchases: May be recommended after the appearance of reversal signals in the support area, as confirmed by your trading system.

EUR/CHF

Brief Analysis:

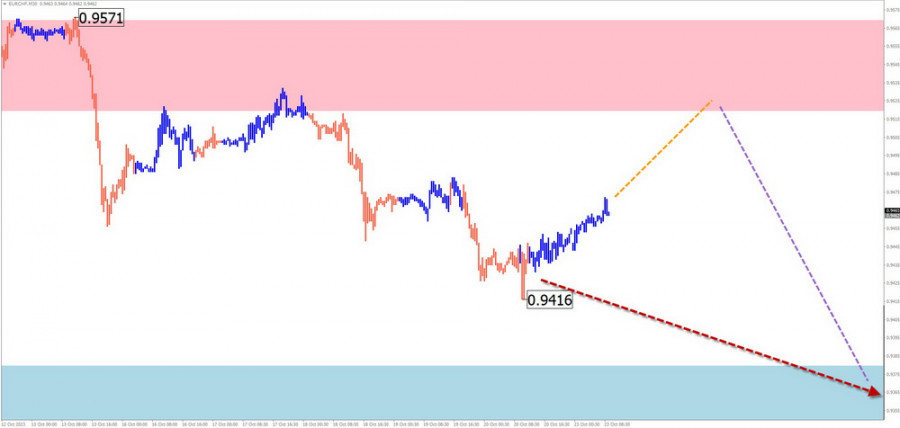
On the euro-to-swiss franc cross chart, a descending trend dominates. An unfinished wave structure in the main direction started in mid-January. Within this, a counter-correction was developed on September 26. The subsequent decline marked the beginning of the final segment (C).

Weekly Forecast:

In the next few days, a flat trend and a short-term retracement towards the resistance zone are likely. Subsequently, a shift to a sideways movement with a reversal formation can be expected. By the end of the week, a resumption of the price decrease can be expected, down to the support levels.

This image is no longer relevant

Potential Reversal Zones

Resistance:

  • 0.9520/0.9570

Support:

  • 0.9380/0.9330

Recommendations

Purchases: have limited potential. Consider reducing your lot size to a minimum and closing deals at the first signs of a reversal.

Sales: will become relevant after the appearance of corresponding signals in the resistance zone, according to your trading systems.

US dollar index

Brief Analysis:

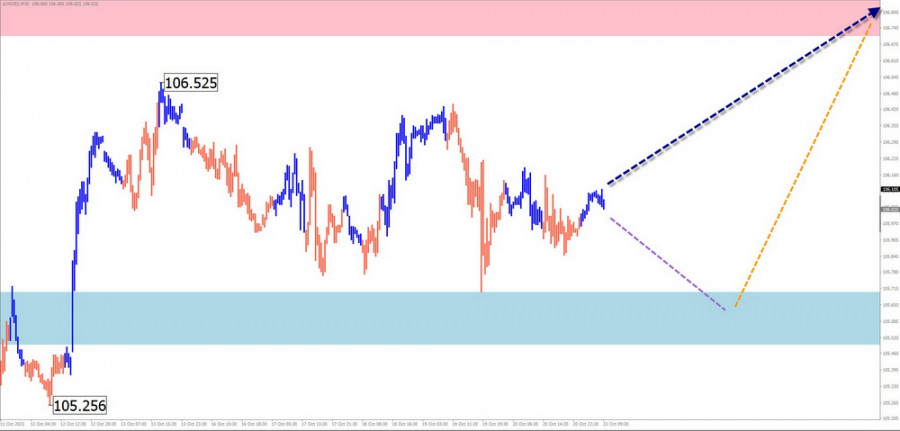
The dollar index continues to recover previously lost positions. Prices rebounded downward from the lower boundary of a strong resistance zone, forming a correctional flat. The current level does not yet indicate reversal potential. The opposing movement remains within the bounds of the correction of the last trending segment.

Weekly Forecast:

At the beginning of the week, a short-term decline in support levels is not ruled out. Subsequently, amidst growing volatility, a resumption of the index's price increase is expected, with quotes rising towards the resistance zone.

This image is no longer relevant

Potential Reversal Zones

Resistance:

  • 106.70/107.20

Support:

  • 105.70/105.20

Recommendations

Purchases: Betting on a stable rise in national currencies in major pairs is premature.

Sales: In the second half of the week, they will become preferable in all major pairs.

Explanation: In simplified wave analysis (SWA), all waves consist of three parts (A, B, and C). On each timeframe (TF), the last unfinished wave is analyzed. Dashed lines indicate expected movements.

Note: The wave algorithm does not consider the duration of movements in time.

เลือกช่วงเวลา
5
นาที
15
นาที
30
นาที
1
ชั่วโมง
4
ชั่วโมง
1
วัน
1
สัปดาห์
รับผลกำไรจากการเปลี่ยนแปลงอัตราสกุลเงินดิจิทัลกับ InstaForex.
ดาวน์โหลด MetaTrader 4 และเปิดการซื้อขายครั้งแรกของคุณ.
กลยุทธ์การซื้อขายระหว่างวันสำหรับนักเทรดมือใหม่ในวันที่ 10 เมษายน สกุลเงินยูโรและปอนด์สามารถทนต่อแรงกดดันจากผู้ขายที่เพิ่มขึ้นและมีการฟื้นตัวเพียงเล็กน้อยในระหว่างเซสชันการซื้อขายในเอเชียวันนี้ เมื่อวานนี้ Donald Trump ได้ประกาศหยุดการเก็บภาษีสินค้านำเข้าเป็นเวลา 90 วัน ซึ่งนำไปสู่การแข็งค่าขึ้นของดอลลาร์สหรัฐและการลดลงของสินทรัพย์เสี่ยงหลายรายการในตลาดเงินต่างประเทศ การกระทำนี้ดูเหมือนจะเป็นความพยายามในการสร้างเสถียรภาพให้กับเศรษฐกิจโลกและตลาดหุ้นสหรัฐในขณะที่ความไม่แน่นอนเพิ่มสูงขึ้น อย่างไรก็ดี ผลกระทบของการตัดสินใจนี้อาจเป็นเพียงชั่วคราวหากไม่มีมาตรการระยะยาวและเชิงโครงสร้างเพิ่มเติม ตลาดตอบสนองทันทีด้วยการเพิ่มขึ้นของความหวัง เนื่องจากนักลงทุนผู้เหน็ดเหนื่อยจากสงครามการค้ายาวนานได้เห็นสัญญาณหนึ่งของการลดปัญหา อย่างไรก็ตาม ผู้เชี่ยวชาญหลายคนเตือนว่า
สิ่งที่ควรให้ความสนใจในวันที่ 10 เมษายน? การวิเคราะห์เหตุการณ์พื้นฐานสำหรับผู้เริ่มต้น มีเหตุการณ์มหภาคเพียงไม่กี่เหตุการณ์ที่กำหนดไว้สำหรับวันพฤหัสบดี แต่รายงานอัตราเงินเฟ้อของสหรัฐฯ ยังคงมีความเกี่ยวข้องสำหรับนักเทรด อย่างไรก็ตาม ปัจจุบัน อัตราเงินเฟ้อมีอิทธิพลจำกัดเนื่องจากแทบทุกคนคาดหวังว่าจะเร่งตัวขึ้นในปี 2025 ดังนั้น แม้ว่าอัตราเงินเฟ้อจะลดลงในวันนี้ ก็ไม่ควรส่งผลต่อท่าทีทางนโยบายการเงินของธนาคารกลางสหรัฐฯ ธนาคารกลางสหรัฐฯ ไม่น่าจะลดอัตราดอกเบี้ยในตอนนี้ เพื่อที่จะปรับขึ้นอีกครั้งในช่วงครึ่งหลังของปี ไม่มีรายงานสำคัญอื่นๆ คาดว่าจะเกิดขึ้นตลอดทั้งวัน
  • Grand Choice
    Contest by
    InstaForex
    InstaForex always strives to help you
    fulfill your biggest dreams.
    เข้าร่วมการแข่งขัน


บทความแนะนำ

การวิเคราะห์ EUR/USD - 8 เมษายน

รูปแบบคลื่นบนกราฟ 4 ชั่วโมงสำหรับ EUR/USD ได้เปลี่ยนเป็นรูปแบบขาขึ้นแล้ว ฉันเชื่อว่าไม่มีข้อสงสัยว่าการเปลี่ยนแปลงนี้สืบเนื่องจากนโยบายการค้าที่ใหม่ของสหรัฐฯ จนถึงวันที่ 28 กุมภาพันธ์ เมื่อค่าเงินดอลลาร์สหรัฐฯเริ่มตกลงอย่างรวดเร็ว ทั้งหมดของโครงสร้างคลื่นดูเหมือนว่าเป็นช่วงแนวโน้มขาลงที่น่าเชื่อถือ โดยที่กำลังเกิดคลื่นปรับฐานที่ 2 ทว่า คำแถลงการณ์รายสัปดาห์จาก

Chin Zhao 19:51 2025-04-08 UTC+2

การวิเคราะห์ GBP/USD - วันที่ 8 เมษายน

รูปแบบคลื่นสำหรับ GBP/USD ก็ได้เปลี่ยนเป็นโครงสร้างคลื่นขาขึ้นเชิงโปร่งใส "ขอบคุณ" Donald Trump รูปแบบคลื่นเกือบจะเหมือนกับ EUR/USD จนถึงวันที่ 28 กุมภาพันธ์ เราสังเกตพัฒนาการของโครงสร้างการปรับฐานที่น่าเชื่อถือซึ่งไม่มีปัญหา อย่างไรก็ตาม ความต้องการของดอลลาร์สหรัฐฯ ก็เริ่มลดลงอย่างรวดเร็ว

Chin Zhao 19:48 2025-04-08 UTC+2

การวิเคราะห์ EUR/USD – วันที่ 7 เมษายน

โครงสร้างคลื่นบนกราฟ 4 ชั่วโมงของคู่สกุลเงิน EUR/USD ได้เปลี่ยนไปเป็นขาขึ้น ผมเชื่อว่าไม่มีใครสงสัยว่าการเปลี่ยนแปลงนี้เกิดขึ้นจากนโยบายการค้าของสหรัฐอเมริกาใหม่อย่างชัดเจน จนถึงวันที่ 28 กุมภาพันธ์ เมื่อเงินดอลลาร์สหรัฐเริ่มลดลงอย่างรวดเร็ว โครงสร้างคลื่นทั้งหมดดูเหมือนเป็นแนวโน้มขาลงที่น่าเชื่อถือ — การสร้างคลื่นแก้ไขที่ 2 อย่างไรก็ตาม

Chin Zhao 19:25 2025-04-07 UTC+2

การวิเคราะห์ GBP/USD – วันที่ 7 เมษายน

โครงสร้างคลื่นของ GBP/USD ได้เปลี่ยนไปสู่ความหมายขึ้นที่คมชัด ในทางการกระตุ้นซึ่งเป็นผลมาจาก "การช่วยเหลือ" ของดอนัลด์ ทรัมป์ รูปแบบคลื่นนั้นเหมือนกับ EUR/USD จนถึงวันที่ 28 กุมภาพันธ์ เราสังเกตการเริ่มปรับปรุงความถูกต้อง ที่เป็นน่าเชื่อถือ แต่หลังจากนั้นความต้องการสกุลเงินดอลลาร์สหรัฐฯ

Chin Zhao 19:22 2025-04-07 UTC+2

การพยากรณ์รายสัปดาห์ตามการวิเคราะห์คลื่นที่เรียบง่ายสำหรับ GBP/USD, AUD/USD, USD/CHF, EUR/JPY, EUR/GBP, และดัชนีดอลลาร์สหรัฐ – 7 เมษายน

GBP/USD การวิเคราะห์: ตั้งแต่เดือนมกราคมของปีนี้ คลื่นขาขึ้นได้กำหนดทิศทางราคาในคู่สกุลเงินหลักของปอนด์อังกฤษ หลังจากไปถึงขอบล่างของโซนการกลับตัวที่มีอิทธิพล ราคาก็เริ่มลดลงอย่างรวดเร็ว ซึ่งเป็นการเริ่มต้นของการปรับฐานที่เต็มรูปแบบ การคาดการณ์: การเคลื่อนไหวในด้านข้างคาดว่าจะเกิดขึ้นในครึ่งแรกของสัปดาห์บริเวณแนวต้าน เมื่อใกล้ถึงวันหยุดสุดสัปดาห์ ราคามีโอกาสที่จะเริ่มลดลงอีกครั้ง ซึ่งมีแนวโน้มว่าจะเป็นผลมาจากความผันผวนที่เพิ่มขึ้นหลังจากการประกาศข่าวสำคัญๆ โซนกลับตัวที่เป็นไปได้: แนวต้าน: 1.2950

Isabel Clark 10:20 2025-04-07 UTC+2

การพยากรณ์รายสัปดาห์ตามการวิเคราะห์คลื่นที่เรียบง่ายสำหรับ EUR/USD, USD/JPY, GBP/JPY, USD/CAD, NZD/USD และ ทองคำ – 7 เมษายน

EUR/USD วิเคราะห์: ตั้งแต่เดือนกุมภาพันธ์ ราคาของเงินยูโรได้เคลื่อนไหวตามรูปแบบคลื่นขาขึ้น ในช่วงเดือนที่ผ่านมา โครงสร้างคลื่นได้เกิดเป็นรูปแบบระนาบที่ยืดออกมา จุดสูงต่ำสุดในกราฟได้ก่อตัวเป็น "สามเหลี่ยมขยาย" ในขณะนี้ ส่วนสุดท้ายของคลื่น (C) กำลังพัฒนาอยู่ คาดการณ์: ราคามีแนวโน้มเคลื่อนไหวในลักษณะขวางภายในแนวต้านกัน ขึ้นทางเป็นไปได้ในช่วงต้นสัปดาห์

Isabel Clark 10:10 2025-04-07 UTC+2

การวิเคราะห์ EUR/USD ในวันที่ 2 เมษายน 2025

รูปแบบคลื่นบนกราฟ 4 ชั่วโมงของ EUR/USD กำลังจะเปลี่ยนเป็นโครงสร้างที่ซับซ้อนมากขึ้น ตั้งแต่วันที่ 25 กันยายนของปีที่แล้ว โครงสร้างคลื่นขาลงใหม่ได้เริ่มก่อตัวขึ้น เป็นรูปแบบห้าคลื่น และเมื่อสามเดือนที่ผ่านมามีโครงสร้างการปรับตัวขึ้นที่เริ่มก่อตัวขึ้น ซึ่งควรจะประกอบด้วยคลื่นอย่างน้อยสามคลื่น ลูกคลื่นอันแรกของการปรับตัวนี้มีรูปร่างที่ชัดเจน ดังนั้นฉันยังคาดหวังว่าคลื่นที่สองจะตามมาด้วยโครงสร้างที่ชัดเจน อย่างไรก็ตาม

Chin Zhao 20:25 2025-04-02 UTC+2

การวิเคราะห์ GBP/USD วันที่ 2 เมษายน 2025

รูปแบบคลื่นของ GBP/USD ยังคงค่อนข้างไม่ชัดเจน แต่โดยทั่วไปจัดการได้ดี ขณะนี้มีความเป็นไปได้สูงที่แนวโน้มขาลงระยะยาวกำลังก่อตัวขึ้น คลื่น 5 ได้มีรูปทรงที่ชัดเจน ดังนั้นผมถือว่าคลื่นใหญ่อันดับที่ 1 เสร็จสมบูรณ์ หากสมมุติฐานนี้ถูกต้อง คลื่นอันดับที่ 2 กำลังอยู่ในกระบวนการของการก่อตัว

Chin Zhao 20:23 2025-04-02 UTC+2

การวิเคราะห์ EUR/USD – 1 เมษายน: อัตราเงินเฟ้อในสหภาพยุโรปยังคงลดลง

โครงสร้างคลื่นบนกราฟ EUR/USD ช่วง 4 ชั่วโมง มีความเสี่ยงที่จะกลายเป็นรูปแบบที่ซับซ้อนยิ่งขึ้น เมื่อวันที่ 25 กันยายนของปีที่ผ่านมา โครงสร้างขาลงใหม่ก็เริ่มก่อตัวขึ้น เป็นรูปแบบคลื่นห้าคลื่นแบบสายลักษณ์ เมื่อ 3 เดือนก่อน รูปแบบแก้ไขขาขึ้นเริ่มต้นขึ้น

Chin Zhao 20:05 2025-04-01 UTC+2

การวิเคราะห์ GBP/USD ประจำวันที่ 1 เมษายน 2025

โครงสร้างคลื่นสำหรับ GBP/USD ยังคงมีความคลุมเครืออยู่บ้างแต่ก็ยังสามารถจัดการได้อย่างทั่วไป ขณะนี้มีความน่าจะเป็นสูงที่จะเกิดแนวโน้มขาลงในระยะยาว คลื่นที่ 5 ได้มีรูปแบบที่น่าเชื่อถือ ดังนั้นฉันจึงถือว่าคลื่นใหญ่ที่ 1 ได้เสร็จสิ้นแล้ว หากสมมุติฐานนี้ถูกต้อง คลื่นที่ 2 ยังอยู่ในระหว่างดำเนินการ คลื่นย่อยสองคลื่นแรกภายในคลื่นที่

Chin Zhao 20:00 2025-04-01 UTC+2
หากไม่สะดวกคุยในตอนนี้
ระบุคำถามไว้ได้ใน แชท.
Widget callback
 

Dear visitor,

Your IP address shows that you are currently located in the USA. If you are a resident of the United States, you are prohibited from using the services of InstaFintech Group including online trading, online transfers, deposit/withdrawal of funds, etc.

If you think you are seeing this message by mistake and your location is not the US, kindly proceed to the website. Otherwise, you must leave the website in order to comply with government restrictions.

Why does your IP address show your location as the USA?

  • - you are using a VPN provided by a hosting company based in the United States;
  • - your IP does not have proper WHOIS records;
  • - an error occurred in the WHOIS geolocation database.

Please confirm whether you are a US resident or not by clicking the relevant button below. If you choose the wrong option, being a US resident, you will not be able to open an account with InstaForex anyway.

We are sorry for any inconvenience caused by this message.