empty
09.10.2023 01:38 PM
Weekly forecast based on simplified wave analysis for GBP/USD, AUD/USD, USD/CHF, EUR/JPY, and US dollar index on October 9th

GBP/USD

Brief Analysis:

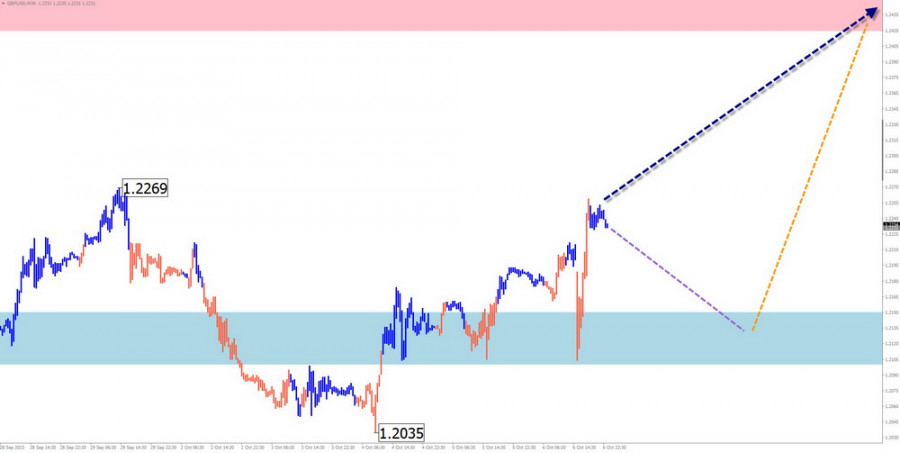
In mid-July, a trend change occurred on the chart of the major British pound sterling. A bearish wave in reverse replaced the uptrend. After contacting the upper boundary of a strong support zone, an ascending corrective wave zigzag formation began. After its complete completion, the price decline will continue.

Week Forecast:

In the upcoming week, the British pound's price movement is expected to continue within a sideways corridor between the nearest areas of counter-direction. After possible pressure on the support zone at the beginning of the week, a bullish vector is most likely. The end of the rise can be expected in the calculated resistance area.

This image is no longer relevant

Potential Reversal Zones

Resistance:

  • 1.2420/1.2470

Support:

  • 1.2150/1.2100

Recommendations:

Purchases: Possible with a reduced lot during separate trading sessions. The potential is limited by the resistance zone.

Sales: Not recommended until the current rise is completed and corresponding signals from your trading systems appear in the resistance area.

AUD/USD

Brief Analysis:

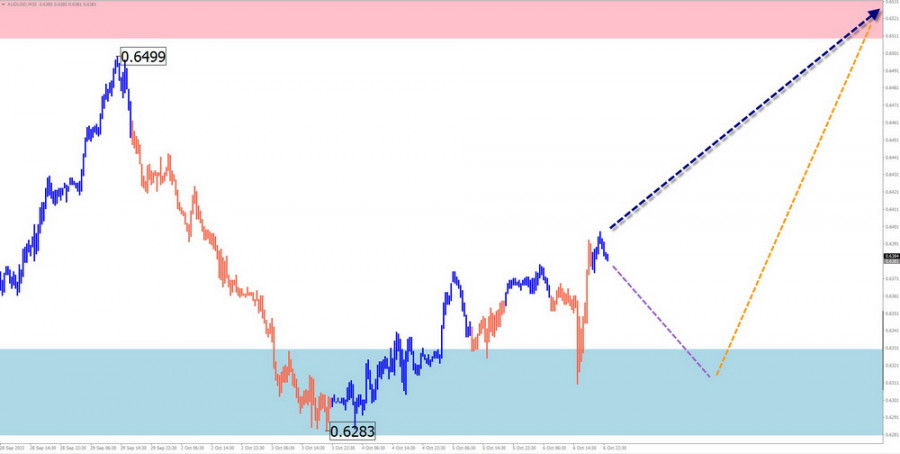
The major pair of the Australian dollar continues its downtrend. In the last two months, a flat correction has been forming. Its structure is close to completion. The price is at the upper boundary of the potential reversal zone for the weekly timeframe. An ascending section has been developing since October 3rd.

Week Forecast:

In the upcoming weekly period, the chart's quotes are expected to move within the previously formed price corridor. After a probable attempt to pressure the support zone at the beginning of the week, a reversal with a change in the direction vector can be expected. The resistance zone demonstrates the most likely upper boundary of the weekly movement of the pair.

This image is no longer relevant

Potential Reversal Zones

Resistance:

  • 0.6510/0.6560

Support:

  • 0.6330/0.6280

Recommendations:

Sales: Will become relevant after appearing in the resistance zone.

Purchases: Will become possible after the appearance of reversal signals confirmed by your trading systems in the support zone.

USD/CHF

Brief Analysis:

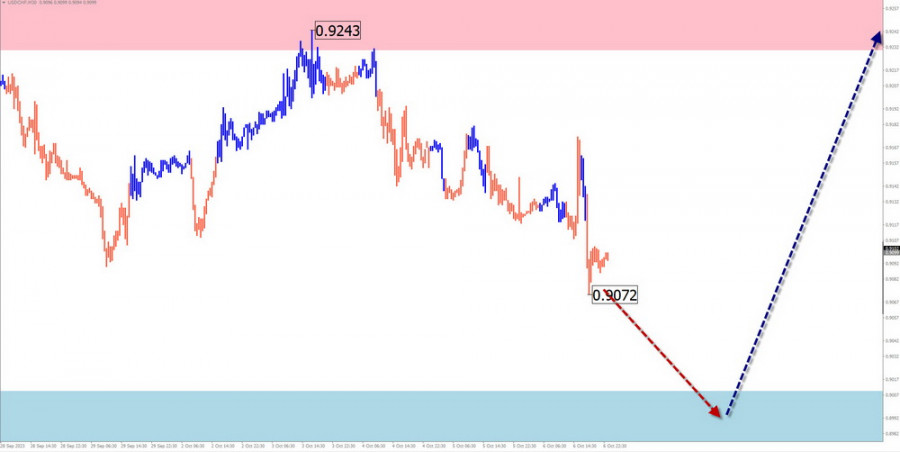
An upward wave has set the direction of the price trend for the Swiss franc since mid-July. The price has reached the lower boundary of the potential reversal zone for the daily timeframe. The wave structure does not look formed at the time of analysis. Quotes from this level have been pulling back down over the past two weeks, forming an intermediate correction.

Week Forecast:

At the beginning of the upcoming week, a decrease in the exchange rate of the pair is expected, down to the calculated support boundaries. Closer to the weekend, the formation of a reversal and a resumption of the price rise can be expected. The support level demonstrates the lower boundary of the expected weekly movement of the pair.

This image is no longer relevant

Potential Reversal Zones

Resistance:

  • 0.9230/0.9280

Support:

  • 0.9010/0.8960

Recommendations

Sales: Possible with a reduced lot during separate trading sessions. The potential is limited by support.

Purchases: Will become relevant after the appearance of confirmed reversal signals in the support zone.

EUR/JPY

Brief Analysis:

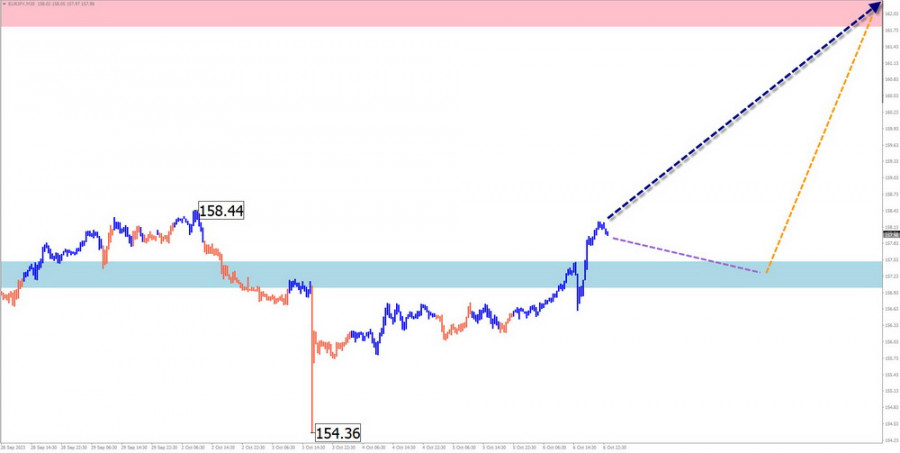
The trend direction of the Euro/Japanese Yen on the chart has been set by an ascending wave algorithm for over three years. The current short-term wave started at the end of July. The analysis of the structure shows the completion of the first two parts (A–B). The pair's quotes mainly move along with the strong support of the senior timeframe.

Week Forecast:

In the first days of the upcoming weekly period, the most likely scenario will be a sideways movement along the support zone. The resumption of price growth can be expected in the second half of the week. Increased volatility and a change in direction may coincide with the release of important economic data.

This image is no longer relevant

Potential Reversal Zones

Resistance:

  • 161.80/162.30

Support:

  • 157.50/157.00

Recommendations

Sales: Have no potential. Can lead to a loss of the deposit.

Purchases: Will be recommended after the appearance of reversal signals in the support zone.

$ (USDollar) Index

Brief Analysis:

The trend direction of the U.S. Dollar Index has been pointing "north" in the price field since the beginning of last year. The unfinished trend section counts as of July 14th. Last week, quotes reached the lower boundary of the potential reversal zone for the weekly timeframe. Subsequent declines form a correction of the last trend section of the wave.

Week Forecast:

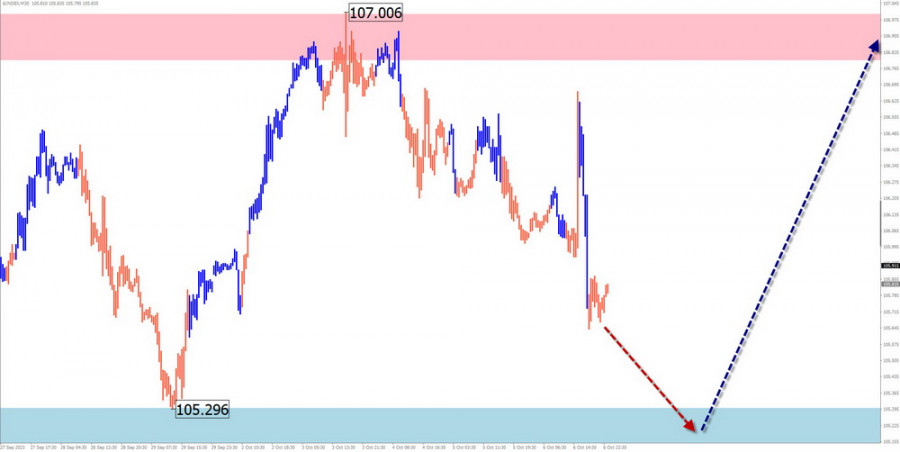
In the coming days, the index's quotes will move sideways with a downward vector. A breakthrough below the calculated support boundary is unlikely. A change in course and a resumption of the upward direction are likely closer to the weekend. The resistance zone demonstrates the upper boundary of the expected weekly movement.

This image is no longer relevant

Potential Reversal Zones

Resistance:

  • 106.80/107.00

Support:

  • 105.30/105.10

Recommendations

Sales: The strengthening of national currencies in major pairs will allow betting on their rise in the coming days.

Purchases: The resumption of the U.S. dollar's strengthening with the sale of national currencies will be recommended after the formation of corresponding reversal signals in the support zone.

Note: In simplified wave analysis (SWA), all waves consist of three parts (A, B, and C). The analysis focuses on the last, unfinished wave in each timeframe. Dotted lines indicate expected movements.

Attention: The wave algorithm does not take into account the duration of instrument movements over time!

เลือกช่วงเวลา
5
นาที
15
นาที
30
นาที
1
ชั่วโมง
4
ชั่วโมง
1
วัน
1
สัปดาห์
รับผลกำไรจากการเปลี่ยนแปลงอัตราสกุลเงินดิจิทัลกับ InstaForex.
ดาวน์โหลด MetaTrader 4 และเปิดการซื้อขายครั้งแรกของคุณ.
  • Grand Choice
    Contest by
    InstaForex
    InstaForex always strives to help you
    fulfill your biggest dreams.
    เข้าร่วมการแข่งขัน


บทความแนะนำ

การวิเคราะห์ GBP/USD ประจำวันที่ 26 มิถุนายน 2025

รูปแบบคลื่นสำหรับ GBP/USD ยังคงบ่งชี้ถึงการพัฒนาของโครงสร้างคลื่นกระตุ้นตลาดในแนวโน้มขาขึ้น รูปแบบคลื่นนี้เกือบจะเหมือนกับของ EUR/USD เนื่องจากปัจจัยสำคัญของการพุ่งขึ้นอยู่ที่สกุลเงินดอลลาร์สหรัฐ ความต้องการสำหรับดอลลาร์กำลังลดลงในตลาดทั้งหมด ทำให้เกิดไดนามิกแบบเดียวกันทั่วทั้งเครื่องมือหลายชนิด คลื่นที่ 2 ของแนวโน้มขาขึ้นได้เปลี่ยนเป็นรูปแบบการปรับฐานคลื่นเดียว ภายในคลื่นที่ 3 ที่คาดการณ์ไว้ มีคลื่นย่อย

Chin Zhao 19:27 2025-06-26 UTC+2

การวิเคราะห์ EUR/USD วันที่ 26 มิถุนายน 2025

รูปแบบคลื่นบนกราฟ 4 ชั่วโมงสำหรับ EUR/USD ยังคงบ่งชี้ถึงการก่อตัวของช่วงแนวโน้มขาขึ้น จนถึงวันที่ 28 กุมภาพันธ์ เมื่อการลดลงของค่าเงินดอลลาร์สหรัฐเริ่มขึ้น โครงสร้างคลื่นทั้งหมดดูเหมือนจะเป็นแนวโน้มขาลงที่น่าเชื่อถือ โดยสร้างคลื่นแก้ไขที่ 2 อย่างไรก็ตาม สงครามทางการค้าที่ Donald

Chin Zhao 19:20 2025-06-26 UTC+2

การวิเคราะห์ EUR/USD วันที่ 25 มิถุนายน 2025

รูปแบบคลื่นในกราฟ 4 ชั่วโมงของ EUR/USD ยังคงบ่งชี้ถึงการก่อตัวของช่วงแนวโน้มขาขึ้น จนถึงวันที่ 28 กุมภาพันธ์ เมื่อค่าเงินดอลลาร์สหรัฐเริ่มอ่อนค่าลง ทั้งรูปแบบคลื่นทั้งหมดดูเหมือนจะเป็นแนวโน้มขาลงที่น่าเชื่อถือ โดยมีคลื่นปรับฐานที่ 2 กำลังหล่อรูป อย่างไรก็ตาม สงครามการค้าที่

Chin Zhao 19:10 2025-06-25 UTC+2

การวิเคราะห์คู่เงิน GBP/USD ประจำวันที่ 24 มิถุนายน 2025

รูปแบบคลื่นสำหรับ GBP/USD ยังคงบ่งชี้ถึงการก่อตัวของชุดคลื่นขาขึ้นแบบเร่งด่วน รูปแบบคลื่นนี้เกือบจะเหมือนกับ EUR/USD เพราะปัจจัยหลักในทั้งสองกรณีนี้ยังคงเป็นดอลลาร์สหรัฐฯ ความต้องการดอลลาร์ลดลงทั่วกระดาน ซึ่งเป็นเหตุผลที่ทำให้เครื่องมือทางการเงินหลายชิ้นมีพลวัตคล้ายกัน คลื่นที่ 2 ของแนวโน้มขาขึ้นได้กลายเป็นรูปแบบคลื่นเดียว ภายในคลื่นที่ 3 ที่คาดการณ์ไว้ คลื่นที่

Chin Zhao 19:35 2025-06-24 UTC+2

การวิเคราะห์ EUR/USD ประจำวันที่ 24 มิถุนายน 2025

รูปแบบคลื่นในแผนภูมิ EUR/USD ระยะ 4 ชั่วโมงยังคงบ่งบอกถึงการเกิดขึ้นของช่วงแนวโน้มขาขึ้น การเปลี่ยนแปลงนี้เกิดขึ้นเนื่องจากนโยบายการค้าใหม่ของสหรัฐอเมริกา จนถึงวันที่ 28 กุมภาพันธ์ เมื่อลงเริ่มของดอลลาร์ ทั้งหมดในรูปแบบคลื่นดูเหมือนจะสร้างช่วงแนวโน้มขาลงที่น่าเชื่อถือ - คลื่นที่ 2 ในช่วงการแก้ไข

Chin Zhao 19:29 2025-06-24 UTC+2

การวิเคราะห์ EUR/USD วันที่ 23 มิถุนายน 2025

รูปแบบการเคลื่อนไหวของกราฟ EUR/USD ระยะเวลา 4 ชั่วโมง ยังคงบ่งบอกถึงการพัฒนาในส่วนของแนวโน้มขาขึ้น การเปลี่ยนแปลงนี้เกิดขึ้นโดยเฉพาะเนื่องจากนโยบายการค้าใหม่ของสหรัฐอเมริกา จนถึงวันที่ 28 กุมภาพันธ์ เมื่อค่าเงินดอลลาร์สหรัฐเริ่มขยับลดลง โครงสร้างการเคลื่อนไหวยังคงดูเหมือนแนวโน้มขาลงที่น่าเชื่อถือ มีการก่อรูปของคลื่นแก้ไขที่ 2 อย่างไรก็ตาม

Chin Zhao 19:08 2025-06-23 UTC+2

การคาดการณ์รายสัปดาห์ตามการวิเคราะห์คลื่นอย่างง่ายสำหรับ GBP/USD, AUD/USD, USD/CHF, EUR/JPY, EUR/GBP และดัชนีเงินดอลลาร์สหรัฐ — วันที่ 23 มิถุนายน

GBP/USD การวิเคราะห์: ตั้งแต่เดือนเมษายน แนวโน้มราคาระยะสั้นของคู่หลักสกุลเงินปอนด์ได้ติดตามคลื่นในทิศทางขาขึ้น ณ วันนี้ โครงสร้างคลื่นยังคงไม่สมบูรณ์ จากช่วงสิ้นเดือนพฤษภาคม ราคาได้มีการถอยกลับจากโซนที่มีศักยภาพในการกลับทิศทางที่สำคัญบนมาตราสัปดาห์ โอกาสที่จะลงต่อยังคงอยู่ในกรอบของการแก้ไข การคาดการณ์: เป็นไปได้ว่าราคาจะถอยกลับไปสู่แนวรับที่คำนวณไว้ หลังจากถึงโซนนี้ คาดว่าจะมีการเคลื่อนไหวด้านข้างเพื่อสร้างพื้นฐานสำหรับการเด้งกลับ ขั้นต่อไปของการขึ้นราคามีแนวโน้มที่จะถูกจำกัดโดยแนวต้านที่คำนวณไว้

Isabel Clark 11:14 2025-06-23 UTC+2

การคาดการณ์รายสัปดาห์ตามการวิเคราะห์คลื่นอย่างง่ายสำหรับ EUR/USD, USD/JPY, GBP/JPY, USD/CAD, NZD/USD และทองคำ — วันที่ 23 มิถุนายน

การพยากรณ์สำหรับวันต่อ ๆ ไป: คาดว่าการเคลื่อนไหวด้านข้างจะยังคงดำเนินต่อไป บริเวณใกล้เคียงกับโซนแนวรับที่กำหนด มีความเป็นไปได้สูงที่จะมีการหยุดชั่วคราวและการสร้างสภาพเงื่อนไขสำหรับการกลับทิศทาง แนวโน้มราคาที่สูงขึ้นคาดว่าจะเกิดขึ้นมากที่สุดช่วงปลายสัปดาห์ การวิเคราะห์: ตั้งแต่ต้นเดือนกุมภาพันธ์ปีนี้ แนวโน้มการผันผวนของราคาหลักของยูโรได้ปฏิบัติตามรูปแบบคลื่นขาขึ้น ตั้งแต่วันที่ 11 เมษายน มีการสร้างคลื่นสวนกลับขึ้น ซึ่งส่วนใหญ่เคลื่อนไหวในแนวระนาบ

Isabel Clark 11:09 2025-06-23 UTC+2

การวิเคราะห์ GBP/USD ประจำวันที่ 17 มิถุนายน 2025

รูปแบบของกราฟ GBP/USD ยังคงบ่งชี้ถึงการก่อตัวของคลื่นแรงกระตุ้นขึ้น โครงสร้างของคลื่นคล้ายคลึงกับ EUR/USD เนื่องจากมีดอลลาร์สหรัฐเป็นตัวขับเคลื่อนหลัก ความต้องการดอลลาร์ลดลงในตลาดกว้าง ซึ่งส่งผลให้เกิดไดนามิกที่คล้ายคลึงกันในหลายเครื่องมือ คลื่น 2 ของช่วงแนวโน้มขาขึ้นมาในรูปของคลื่นเดี่ยว ในคลื่นที่คาดว่าเป็นคลื่น 3 คลื่น

Chin Zhao 21:24 2025-06-17 UTC+2

การวิเคราะห์ EUR/USD ณ วันที่ 17 มิถุนายน 2025

รูปแบบคลื่นในกราฟ EUR/USD 4 ชั่วโมงยังคงบ่งบอกถึงการพัฒนาของขาขึ้นของแนวโน้ม การเปลี่ยนแปลงนี้เกิดขึ้นเนื่องจากนโยบายการค้าของสหรัฐอเมริกาใหม่เท่านั้น จนกระทั่งถึงวันที่ 28 กุมภาพันธ์ ที่เริ่มต้นการลดลงของเงินดอลลาร์สหรัฐ รูปแบบคลื่นทั้งหมดดูเหมือนจะสร้างแนวโน้มขาลงที่น่าเชื่อถือ ขณะนั้นคลื่นแก้ไขตัวเลข 2 กำลังอยู่ในระหว่างการสร้าง อย่างไรก็ตาม การเริ่มต้นสงครามการค้าของ

Chin Zhao 21:18 2025-06-17 UTC+2
หากไม่สะดวกคุยในตอนนี้
ระบุคำถามไว้ได้ใน แชท.
Widget callback
 

Dear visitor,

Your IP address shows that you are currently located in the USA. If you are a resident of the United States, you are prohibited from using the services of InstaFintech Group including online trading, online transfers, deposit/withdrawal of funds, etc.

If you think you are seeing this message by mistake and your location is not the US, kindly proceed to the website. Otherwise, you must leave the website in order to comply with government restrictions.

Why does your IP address show your location as the USA?

  • - you are using a VPN provided by a hosting company based in the United States;
  • - your IP does not have proper WHOIS records;
  • - an error occurred in the WHOIS geolocation database.

Please confirm whether you are a US resident or not by clicking the relevant button below. If you choose the wrong option, being a US resident, you will not be able to open an account with InstaForex anyway.

We are sorry for any inconvenience caused by this message.