empty
10.01.2024 02:05 PM
Trading Signals for EUR/USD on January 10-12, 2024: buy if breaks 1.0955 (21 SMA - symmetrical triangle)

This image is no longer relevant

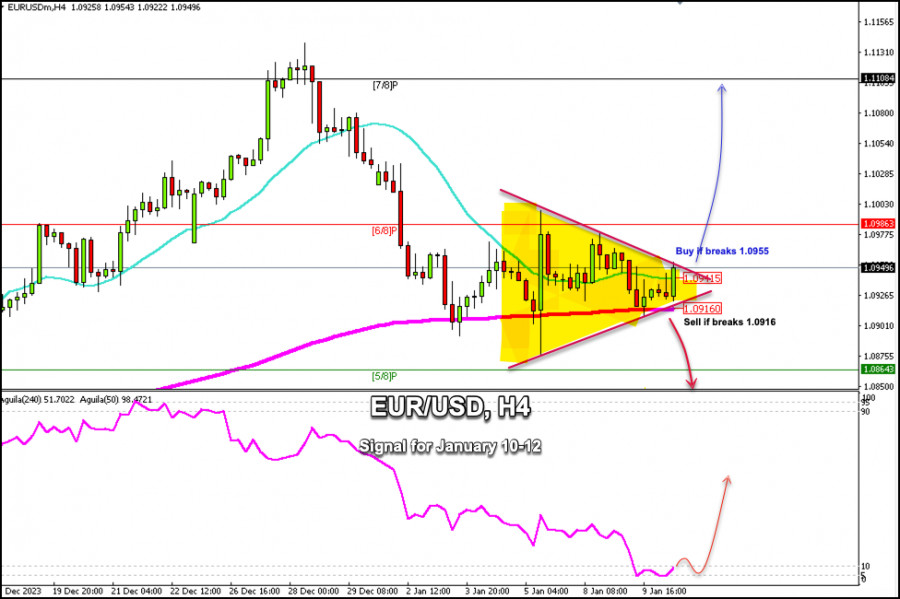
Early in the American session, the euro is trading around 1.0949 within a symmetrical triangle pattern valid since early January. This consolidation is due to some uncertainty in the market ahead of inflation data in the US, which causes the euro to get stuck in increasingly narrow ranges.

According to the H4 chart, we can see that the euro has found good support above the 200 EMA located at 1.0916 which could give EUR/USD a positive outlook for the coming days, only if the euro settles above this area.

Additionally, a sharp break above this symmetrical pattern and a close above 1.0955 on the H4 chart could enable the euro to continue rising. EUR/USD could reach 6/8 Murray at 1.0986 and even the psychological level of 1.10. From there, it could reach the 7/ 8 Murray located at 1.1084.

On the contrary, if the Euro falls below the 200 EMA and breaks the symmetrical triangle pattern below 1.0916, we could expect the main downtrend to resume and EUR/USD could reach 5/8 Murray at 1.0864 and even 4/8 of Murray located at 1.0742.

Given that the euro is facing the possibility of a break in one of the directions of the symmetrical triangle, it should first gain strong momentum to clarify a new trend. Therefore, we could be waiting for this to happen to be able to decide whether to buy or sell. If this scenario does not occur, the euro could trade within a range between 1.0955 and 1.0915.

Summary
Urgency
Analytic
Dimitrios Zappas
Start trade
รับผลกำไรจากการเปลี่ยนแปลงอัตราสกุลเงินดิจิทัลกับ InstaForex.
ดาวน์โหลด MetaTrader 4 และเปิดการซื้อขายครั้งแรกของคุณ.
  • Grand Choice
    Contest by
    InstaForex
    InstaForex always strives to help you
    fulfill your biggest dreams.
    เข้าร่วมการแข่งขัน


บทความแนะนำ

ค่าเงินปอนด์ยังคงมีโอกาสที่จะปรับตัวลงไปถึงระดับแนวรับในวันจันทร์ที่ 14 กรกฎาคม 2025 ต่อไปได้

GBP/USD – วันจันทร์ที่ 14 กรกฎาคม 2025 ค่าเงิน GBP/USD กำลังอยู่ในสภาวะที่อ่อนแอ ซึ่งยืนยันได้จากการเคลื่อนไหวของราคาที่อยู่ต่ำกว่าเส้นค่าเฉลี่ยเคลื่อนที่ 50 วัน (50-EMA) และยังอยู่ต่ำกว่าเส้นค่าเฉลี่ยเคลื่อนที่

Arief Makmur 07:21 2025-07-14 UTC+2

คู่สกุลเงินสินค้าโภคภัณฑ์ USD/CAD มีแนวโน้มที่จะปรับตัวไปยังจุดหมุนในวันนี้ วันจันทร์ที่ 14 กรกฎาคม 2025

USD/CAD, 14 กรกฎาคม 2025 แม้ว่า Lonnie จะปรับตัวในทิศทางที่เป็นกลาง-ลาดขึ้น แต่ก็ยังมีโอกาสที่คู่สกุลเงิน USD/CAD จะทดสอบระดับ Pivot และแนวรับในวันนี้ ระดับสำคัญ 1. แนวต้าน

Arief Makmur 07:21 2025-07-14 UTC+2

การคาดการณ์ EUR/USD สำหรับวันที่ 14 กรกฎาคม 2025

แท่งเทียนของวันศุกร์สำหรับคู่สกุลเงิน EUR/USD ปิดในลักษณะขาลง โดยราคาปรับฐานต่ำกว่าระดับเส้น MACD รายวัน เป้าหมายสำหรับวันนี้คือการปิดที่ต่ำกว่าระดับ 1.1692 เพื่อให้บรรลุเป้าหมายนี้ แท่งเทียนรายวันต้องปิดต่ำกว่าระดับดังกล่าว ทั้งนี้ ตัวบ่งชี้ Marlin ยังไม่เข้าสู่โซนลบ แต่คาดว่าจะทำได้ในวันพรุ่งนี้

Laurie Bailey 05:31 2025-07-14 UTC+2

การพยากรณ์ GBP/USD สำหรับวันที่ 14 กรกฎาคม 2025

เมื่อวันศุกร์ที่ผ่านมา เงินปอนด์ของอังกฤษอ่อนค่าลงกว่า 80 pips โดยลดลงต่ำกว่าระดับสมดุลรายวันและระดับสัญญาณสำคัญที่ 1.3510 การลดลงนี้ถูกกระตุ้นจากข้อมูล GDP และการผลิตอุตสาหกรรมที่อ่อนแอ การประมาณการ GDP ในเดือนพฤษภาคมแสดงให้เห็นว่า -0.1% เทียบกับที่คาดการณ์ไว้ที่ +0.1%

Laurie Bailey 05:31 2025-07-14 UTC+2

พยากรณ์ AUD/USD สำหรับวันที่ 14 กรกฎาคม 2025

บนกราฟรายวัน คู่เงิน AUD/USD อยู่ระหว่างเส้น MACD (0.6551) และขอบบนของช่องราคาท้องถิ่น (สีน้ำเงิน, 0.6597) การฝ่าเส้นระดับใดระดับหนึ่งจะแสดงถึงความตั้งใจของราคาที่จะไปต่อในทิศทางที่เลือก อย่างไรก็ตาม สำหรับเป้าหมายด้านบวก ระดับ 0.6650 นั้นใกล้เคียงมาก

Laurie Bailey 05:31 2025-07-14 UTC+2

คาดการณ์สำหรับ EUR/USD ในวันที่ 11 กรกฎาคม 2025

เมื่อวันพฤหัสบดี คู่สกุลเงิน EUR/USD ยังคงปรับตัวลดลงไปยังระดับ 1.1645 ขณะที่ระดับการแก้ไข Fibonacci ที่ 127.2% ที่ 1.1712 ส่วนใหญ่ถูกละเลยโดยผู้ค้า การฟื้นตัวจากระดับ 1.1645 จะเอื้อประโยชน์ให้กับเงินยูโรและอาจนำไปสู่การเพิ่มขึ้นในระดับปานกลางไปยัง

Samir Klishi 12:44 2025-07-11 UTC+2

การคาดการณ์ GBP/USD วันที่ 11 กรกฎาคม 2025

ในกราฟรายชั่วโมง คู่สกุลเงิน GBP/USD เมื่อวันพฤหัสบดีได้ดีดตัวจากแนวต้านที่ระดับ 1.3611–1.3633 และกลับมาเคลื่อนไหวลดลงไปที่ระดับ 127.2% ของ Fibonacci ที่ 1.3527 การดีดตัวจากระดับนี้จะส่งผลดีต่อฝ่ายปอนด์และอาจทำให้ราคากลับขึ้นไปที่ระดับ 1.3611–1.3633 ได้ การปิดต่ำกว่าระดับ

Samir Klishi 12:20 2025-07-11 UTC+2

แม้จะมีโอกาสในการปรับฐาน แต่ทองคำยังมีศักยภาพที่จะเพิ่มขึ้นในวันนี้ วันศุกร์ที่ 11 กรกฎาคม 2025

XAU/USD, วันศุกร์ที่ 11 กรกฎาคม 2025 แม้ว่าดูเหมือนว่าจะปรับฐานเนื่องจากถูกถือไว้ที่แนวต้าน 1 แต่ด้วยสภาวะทางเทคนิคและปัจจัยพื้นฐานที่แข็งแกร่งต่อเนื่องของ XAU/USD เปิดโอกาสให้ XAU/USD ยังมีแนวโน้มแข็งค่าต่อไปได้ ระดับที่สำคัญ 1. แนวต้าน

Arief Makmur 08:00 2025-07-11 UTC+2

การคาดการณ์สำหรับ EUR/USD วันที่ 11 กรกฎาคม 2025

บนกราฟรายสัปดาห์ของ EUR/USD เราพบชุดสัญญาณการกลับตัวที่ประกอบไปด้วย: การเกิด divergence, การเปลี่ยนแปลงแนวโน้มในโซนเวลาฟีโบนัชชี, และการดีดตัวของราคาเมื่อเกิดการตัดกันระหว่างสองเส้นที่แข็งแกร่ง — ขอบเขตของช่องราคากับรังสีฟีโบนัชชี. หากสัปดาห์ปิดแม้อยู่ที่ระดับปัจจุบัน แนวถนนระยะยาวขาลง (มุ่งสู่ 0.9260) จะเปิดสำหรับยูโร บนกราฟรายวัน

Laurie Bailey 06:58 2025-07-11 UTC+2

การพยากรณ์ GBP/USD สำหรับวันที่ 11 กรกฎาคม 2025

บนกราฟรายเดือน GBP/USD ปอนด์อังกฤษได้ปรับตัวกลับจากระดับตอบสนองฟีโบนักชีที่ 161.8% ซึ่งคำนวณจากขอบด้านบนของช่องราคาทั่วโลกในระยะเวลา 18 ปีทันทีหลังจากเส้นเวลา Fibonacci เส้นที่ 8 ค่าเงินปอนด์อาจเผชิญกับการลดลงในระยะยาว ซึ่งอาจจะเป็นไปได้ถึงขั้นที่น่ากังวลไปจนถึงระดับที่เสมอภาคได้ บนกราฟรายสัปดาห์ เราได้สังเกตการแยกตัวและระดับเป้าหมายที่อยู่ใกล้สองระดับ (เมื่อเทียบกับช่วงเวลานี้)

Laurie Bailey 06:46 2025-07-11 UTC+2
หากไม่สะดวกคุยในตอนนี้
ระบุคำถามไว้ได้ใน แชท.
Widget callback
 

Dear visitor,

Your IP address shows that you are currently located in the USA. If you are a resident of the United States, you are prohibited from using the services of InstaFintech Group including online trading, online transfers, deposit/withdrawal of funds, etc.

If you think you are seeing this message by mistake and your location is not the US, kindly proceed to the website. Otherwise, you must leave the website in order to comply with government restrictions.

Why does your IP address show your location as the USA?

  • - you are using a VPN provided by a hosting company based in the United States;
  • - your IP does not have proper WHOIS records;
  • - an error occurred in the WHOIS geolocation database.

Please confirm whether you are a US resident or not by clicking the relevant button below. If you choose the wrong option, being a US resident, you will not be able to open an account with InstaForex anyway.

We are sorry for any inconvenience caused by this message.