empty
10.06.2022 06:44 AM
Forecast and trading signals for GBP/USD for June 10. COT report. Detailed analysis of the pair's movement and trade deals. The British pound remains inside the horizontal channel

GBP/USD 5M

This image is no longer relevant

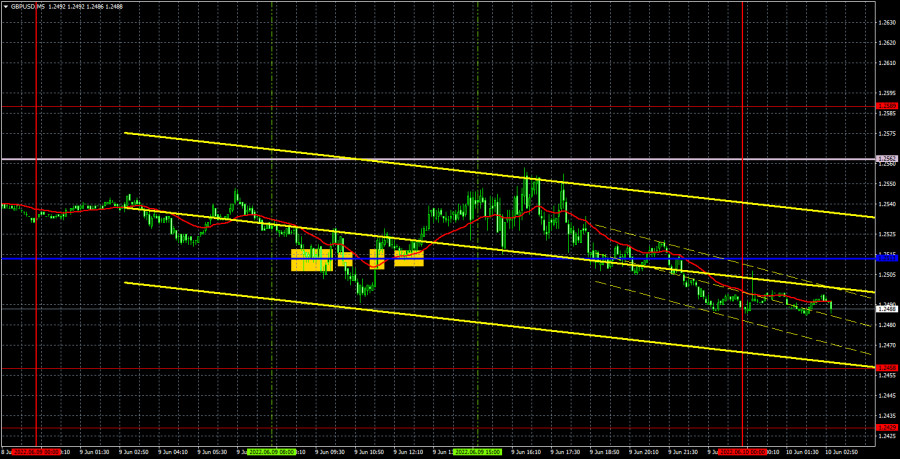
The GBP/USD currency pair did not show anything interesting on Thursday. An incomprehensible movement was observed all day, which is difficult to classify like a flat, but you can't call it a trend either. Traders ignored the Ichimoku indicator lines, which is not surprising, since we have a pronounced flat at the timeframe. Or a "swing." One way or another, but when the price moves mainly to the side, there is no need to talk about good movements or good signals. Moreover, not a single significant macroeconomic report was published during the day. Therefore, the volatility was low. Thus, it is not possible to make any high-profile conclusions. You need to wait for the pair to leave the horizontal channel or trade from its borders to the rebound.

There were few trading signals on Thursday, but they were all extremely inaccurate. This is also not surprising, since all of them were formed near the critical line, which is not a good source of trading signals in the flat, which we already talked about in past articles. As a result, all signals except the latter were false. It was possible to try only the first two, and even if you ignored our recommendations about being cautious when opening positions. Because even the first signal showed that the market does not know what to do with the pair. It is impossible to understand what it was: a rebound from the Kijun-Sen line or its breakthrough. Therefore, it was better to bypass this signal. The second signal for short positions led to a fall at 17 points, which was not enough to put Stop Loss to breakeven.

COT report:
This image is no longer relevant

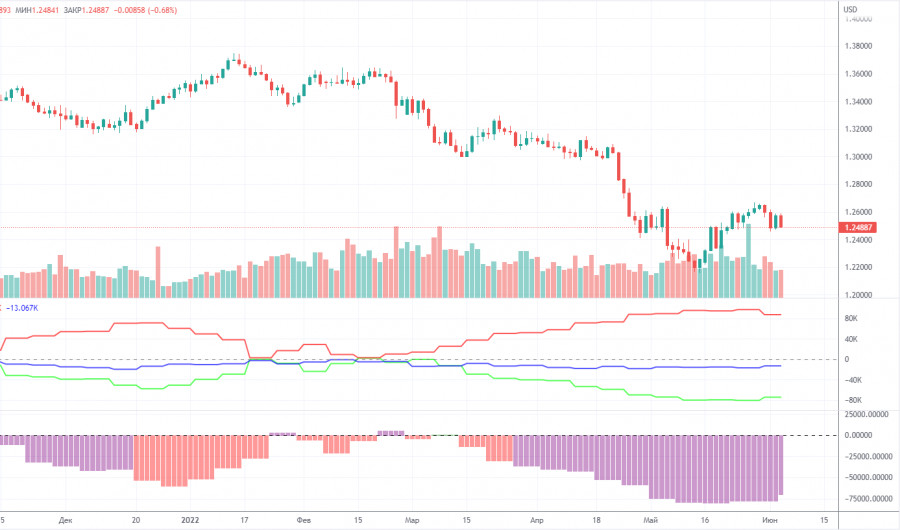
The latest Commitment of Traders (COT) report on the British pound showed minimal changes. During the week, the non-commercial group opened 4,800 long positions and closed 1,400 short positions. Thus, the net position of non-commercial traders increased by 6,200, for the first time in a long time. The net position has been falling for three months, which is perfectly visualized by the green line of the first indicator in the chart above or the histogram of the second indicator. Therefore, one increase in this indicator is unlikely to unambiguously indicate the end of the downward trend for the pound. The non-commercial group has already opened a total of 105,000 shorts and only 31,000 longs. Thus, the difference between these numbers is already more than three times. This means that the mood among professional traders now remains "pronounced bearish". We note that in the case of the pound, the COT data very accurately reflects what is happening in the market: the mood of traders is "very bearish", and the pound has been falling against the US dollar for a long time. In the past few weeks, the pound has shown growth, but even in the chart for this paragraph (daily timeframe), this movement looks very weak. Since in the case of the pound, the COT report reflects the real picture of things, we note that a strong divergence of the red and green lines of the first indicator often means the end of the trend. Therefore, formally now we can count on a new upward trend. However, weak geopolitical, fundamental and macroeconomic backgrounds for European currencies may again put pressure on them.

We recommend to familiarize yourself with:

Overview of the EUR/USD pair. June 10. Expected and predictable: The ECB did not raise the rate, but gave hope to traders.

Overview of the GBP/USD pair. June 10. The central banks of the world synchronously missed inflation and are now reaping the benefits.

Forecast and trading signals for EUR/USD on June 10. Detailed analysis of the movement of the pair and trading transactions.

GBP/USD 1H
This image is no longer relevant

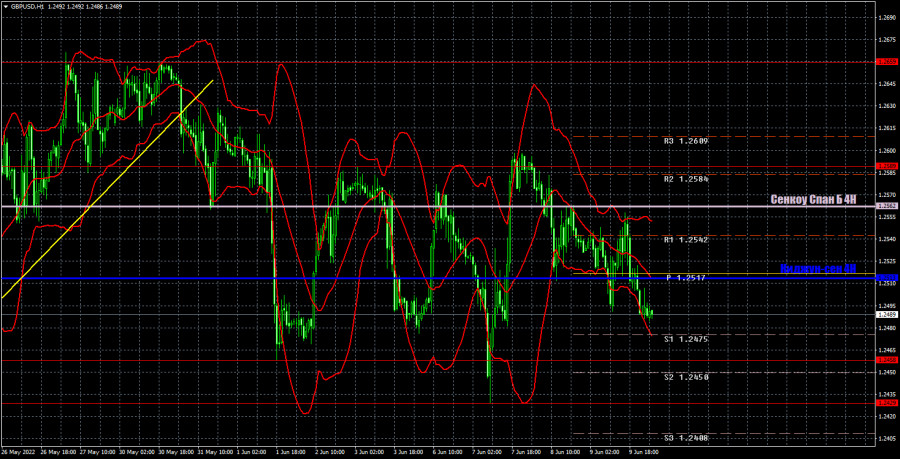
The pair is already definitely trading in the "swing" mode on the hourly timeframe, which leads to forming false signals, and the lines of the Ichimoku indicator lost their strength. Therefore, you should be very careful when opening any positions. It is best to work out the most accurate and strong signals - preferably for a rebound from levels of 1.2458 and 1.2589. Today, we distinguish the following important levels: 1.2259, 1.2429, 1.2458, 1.2589, 1.2659. Senkou Span B (1.2562) and Kijun-Sen (1.2513) can also be sources of signals. Signals can be "rebounds" and "breakthroughs" of these levels and lines. It is recommended to set the Stop Loss to breakeven when the price passes in the right direction by 20 points. The lines of the Ichimoku indicator can move during the day, which should be taken into account when determining trading signals. There are also support and resistance levels on the chart that can be used to take profits on transactions. Nothing interesting is planned for Friday in the UK. An inflation report will be released in America, but it will provoke a reaction from traders only if its actual value is very different from the forecast. We can see good volatility, but the pair will most likely remain inside the horizontal channel.

Explanations for the chart:

Support and Resistance Levels are the levels that serve as targets when buying or selling the pair. You can place Take Profit near these levels.

Kijun-sen and Senkou Span B lines are lines of the Ichimoku indicator transferred to the hourly timeframe from the 4-hour one.

Support and resistance areas are areas from which the price has repeatedly rebounded off.

Yellow lines are trend lines, trend channels and any other technical patterns.

Indicator 1 on the COT charts is the size of the net position of each category of traders.

Indicator 2 on the COT charts is the size of the net position for the non-commercial group.

Paolo Greco,
ผู้เชี่ยวชาญด้านการวิเคราะห์ของ InstaForex
© 2007-2025
เลือกช่วงเวลา
5
นาที
15
นาที
30
นาที
1
ชั่วโมง
4
ชั่วโมง
1
วัน
1
สัปดาห์
รับผลกำไรจากการเปลี่ยนแปลงอัตราสกุลเงินดิจิทัลกับ InstaForex.
ดาวน์โหลด MetaTrader 4 และเปิดการซื้อขายครั้งแรกของคุณ.
การวิเคราะห์ EUR/USD - 31 มีนาคม โครงสร้างคลื่นบนแผนภูมิ 4 ชั่วโมงของ EUR/USD กำลังมีความเสี่ยงที่จะเปลี่ยนรูปร่างเป็นรูปแบบที่ซับซ้อนยิ่งขึ้น ในวันที่ 25 กันยายนปีที่ผ่านมา โครงสร้างลดลงใหม่เริ่มที่จะการสร้างและอยู่ในรูปแบบของลัพธ์คลื่นห้า สามเดือนที่ผ่านมา โครงสร้างแก้ไขขึ้นเริ่มที่จะการสร้างในที่ควรจะประกอบด้วยคลื่นอย่างน้อยสามคลื่น โครงสร้างของคลื่อแรกถูกสร้างขึ้นอย่างดีและจึงทำให้ฉันคาดว่าคลื่นที่สองจะต้องมีรูปร่างที่ชัดเจนเช่นเดียวกัน อย่างไรก็ตาม ขนาดของคลื่นนี้ใหญ่มากจนเป็นอันตรายถ้ามันเปลี่ยนรูปแบบคลื่นอย่างมาก ข่าวสารที่ส่งออกมายังคงสนับสนุนผู้ขายมากกว่าผู้ซื้อเมื่อมาถึงข้อมูลทางเศรษฐกิจ
  • Grand Choice
    Contest by
    InstaForex
    InstaForex always strives to help you
    fulfill your biggest dreams.
    เข้าร่วมการแข่งขัน


บทความแนะนำ

GBP/USD: แผนการเทรดสำหรับช่วงตลาดสหรัฐในวันที่ 31 มีนาคม (วิเคราะห์การเทรดในช่วงเช้า)

ในคำทำนายตอนเช้าของฉัน ฉันได้มุ่งเน้นไปที่ระดับ 1.2966 และวางแผนการตัดสินใจในการซื้อขายโดยอิงจากระดับนี้ ลองดูแผนภูมิ 5 นาทีและวิเคราะห์ว่าเกิดอะไรขึ้น มีการเพิ่มขึ้นตามด้วยการทะลุออกปลอมใกล้ระดับ 1.2966 ซึ่งให้โอกาสขายสำหรับเงินปอนด์ ทำให้ราคาลดลงไปยังแนวรับตอนเช้าที่ 1.2945 การทะลุและการทดสอบระดับนี้อีกครั้งให้สัญญาณอีกครั้งในการขาย ทำให้คู่สกุลเงินลดลงไปที่ 1.2922

Miroslaw Bawulski 19:52 2025-03-31 UTC+2

EUR/USD: แผนการเทรดสำหรับช่วงเซสชันสหรัฐอเมริกาในวันที่ 31 มีนาคม (วิเคราะห์การซื้อขายในช่วงเช้า)

ในการพยากรณ์เช้านี้ ฉันได้ระบุระดับ 1.0829 ไว้และวางแผนที่จะตัดสินใจการซื้อขายบนฐานตัวเลขดังกล่าว มาดูกราฟ 5 นาทีเพื่อดูว่าเกิดอะไรขึ้น การลดลงตามมาด้วยการทะลุขึ้นผิดพลาดรอบ ๆ ระดับ 1.0829 ซึ่งให้จุดเริ่มต้นสำหรับตำแหน่งซื้อ ส่งผลให้คู่เงินขึ้นไป 20 จุด

Miroslaw Bawulski 19:50 2025-03-31 UTC+2

วิธีการเทรดคู่สกุลเงิน GBP/USD ในวันที่ 31 มีนาคม? เคล็ดลับง่ายๆ และการวิเคราะห์การเทรดสำหรับผู้เริ่มต้น

คู่เงิน GBP/USD มีการเคลื่อนไหวในแนวนอนในวันศุกร์ ซึ่งแตกต่างจากคู่เงิน EUR/USD และนั่นค่อนข้างแปลก เนื่องจากเงินปอนด์อังกฤษได้เคลื่อนไหวในช่วงแบบแบนโดยไม่มีขอบเขตที่ชัดเจนมาหลายสัปดาห์แล้ว อย่างไรก็ตาม การเคลื่อนไหวในแนวนอนยังคงสามารถมองเห็นได้ชัดเจน เงินปอนด์ไม่ตกและไม่ขึ้น อย่างน่าสนใจ เงินยูโรไม่มีเหตุผลมากพอที่จะขึ้นในวันศุกร์ ทั้งๆ ที่เงินปอนด์มี มีข้อมูล

Paolo Greco 03:21 2025-03-31 UTC+2

วิธีเทรดคู่เงิน EUR/USD ในวันที่ 31 มีนาคม? เคล็ดลับง่ายๆ และการวิเคราะห์การเทรดสำหรับผู้เริ่มต้น

ในวันศุกร์ คู่สกุลเงิน EUR/USD มีการซื้อขายเพิ่มขึ้นอีกครั้ง เราไม่สามารถสรุปว่าเหตุการณ์ทางเศรษฐกิจมหภาคสนับสนุนการเคลื่อนไหวนี้ได้ ขณะนี้ไม่น่าแปลกใจที่ดอลลาร์สามารถลดลงได้ทุกเมื่อ สิ่งที่ต้องจำคือสกุลเงินดอลลาร์สหรัฐยังคงอยู่ภายใต้แรงกดดันจาก Donald Trump เมื่อวันพฤหัสบดีที่ผ่านมา เขาได้กำหนดภาษีใหม่ ซึ่งส่งผลให้มูลค่าของดอลลาร์ลดลงอีก อย่างไรก็ตาม ในวันศุกร์ อัตราการว่างงานในประเทศเยอรมนีเพิ่มขึ้น

Paolo Greco 03:21 2025-03-31 UTC+2

GBP/USD: แผนการเทรดสำหรับช่วงตลาดสหรัฐวันที่ 28 มีนาคม (รีวิวการเทรดช่วงเช้า)

ในการพยากรณ์ช่วงเช้าของฉัน ฉันได้มุ่งเน้นไปที่ระดับ 1.2964 และวางแผนที่จะตัดสินใจเข้าสู่ตลาดตามระดับนี้ มาดูกราฟ 5 นาทีและวิเคราะห์สิ่งที่เกิดขึ้น การเพิ่มขึ้นและการทะลุผ่านเท็จรอบๆ 1.2964 ทำให้เกิดสัญญาณขายสำหรับปอนด์ ซึ่งส่งผลให้เกิดการลดลงไปยังระดับสนับสนุนในตอนเช้าที่ 1.2940 จากที่ฉันเคยซื้อ GBP/USD ในช่วงเริ่มต้นของเซสชั่นยุโรป

Miroslaw Bawulski 18:54 2025-03-28 UTC+2

EUR/USD: แผนการซื้อขายสำหรับช่วงการซื้อขายในสหรัฐอเมริกาวันที่ 28 มีนาคม (การวิเคราะห์การซื้อขายตอนเช้า)

ในคาดการณ์ช่วงเช้าของฉัน ฉันได้เน้นไปที่ระดับ 1.0801 และวางแผนที่จะใช้เป็นฐานในการเข้าตลาด ลองมาดูกราฟ 5 นาทีเพื่อดูว่าเกิดอะไรขึ้น การเพิ่มขึ้นและการเบรกหลอกที่ระดับ 1.0801 ทำให้มีโอกาสในการเปิดตำแหน่งขายระยะสั้น ซึ่งส่งผลให้คู่สกุลเงินตกลงไปมากกว่า 35 จุดถึงระดับเป้าหมายที่ 1.0764 ภาพทางเทคนิคไม่ได้รับการปรับปรุงใหม่ในครึ่งหลังของวัน

Miroslaw Bawulski 18:52 2025-03-28 UTC+2

วิธีการเทรดคู่สกุลเงิน GBP/USD ในวันที่ 28 มีนาคม? เคล็ดลับง่ายๆ และการวิเคราะห์การเทรดสำหรับผู้เริ่มต้น

เมื่อวันพฤหัสบดี คู่สกุลเงิน GBP/USD ก็มีการซื้อขายสูงขึ้นอีกแล้ว—และค่อนข้างแข็งแกร่ง แม้จะมีการเผยแพร่รายงาน GDP ไตรมาสที่ 4 ที่มั่นคงในสหรัฐอเมริกา แต่มันไม่ได้ทำให้ความกดดันต่อตลาดเงินดอลลาร์ลดลงเลย เหตุผลเนื่องจากเมื่อค่ำคืนก่อนหน้า Donald Trump ได้ประกาศภาษีนำเข้าใหม่สำหรับทุกประเทศที่ส่งออกรถยนต์มายังสหรัฐอเมริกา เป็นผลให้เงินปอนด์ยังไม่เริ่มการลดลงที่คาดหวังไว้

Paolo Greco 06:05 2025-03-28 UTC+2

วิธีการเทรดคู่สกุลเงิน EUR/USD ในวันที่ 28 มีนาคม เคล็ดลับง่ายๆ และการวิเคราะห์การเทรดสำหรับผู้เริ่มต้น

คู่สกุลเงิน EUR/USD เพิ่มขึ้นถึงระดับ 1.0804 เมื่อวันพฤหัสบดี การเพิ่มขึ้นของค่าเงินยูโร (หรือที่จริงแล้ว เป็นการลดลงของดอลล่าร์) อย่างฉับพลันและค่อนข้างแข็งแรงนี้มีเพียงหนึ่งคนที่จะทำให้เกิดขึ้นได้—โดนัลด์ ทรัมป์ ช่วงกลางคืนที่ผ่านมานี้เขาได้ประกาศภาษีใหม่กับการนำเข้าไปยังสหรัฐฯ โดยครั้งนี้เล็งเป้าหมายไปยังรถยนต์ที่ผลิตในต่างประเทศทั้งหมด Elon Musk ต่างเฉลิมฉลอง

Paolo Greco 06:05 2025-03-28 UTC+2

คำแนะนำและการวิเคราะห์การซื้อขายสำหรับ GBP/USD วันที่ 28 มีนาคม: ปอนด์ยังคงแกว่งตัว

คู่สกุลเงิน GBP/USD แสดงการเคลื่อนไหวขึ้นในวันพฤหัสบดีอย่างเต็มที่ แน่นอนว่าปัจจัยเร่งให้เกิดการเปลี่ยนแปลงนี้คือ Donald Trump อีกครั้ง โดยเขาได้กำหนดภาษี 25% ใหม่สำหรับสินค้านำเข้ารถยนต์ทั้งหมดเข้าสู่สหรัฐฯ ไม่ต้องพูดถึงเลยว่าตลาดได้โละดอลลาร์ออกไปเหมือนเป็นฝันร้าย ไม่แม้กระทั่งรายงาน GDP ของสหรัฐฯ ที่แสดงการเติบโตในไตรมาสสี่ที่

Paolo Greco 02:47 2025-03-28 UTC+2

คำแนะนำและการวิเคราะห์การเทรดสำหรับ EUR/USD ณ วันที่ 28 มีนาคม: ภาษีศุลกากรของ Trump และ GDP

ในวันพฤหัสบดี คู่สกุลเงิน EUR/USD ทะยานขึ้นอย่างรวดเร็วโดยไม่ทำลายแนวโน้มขาลงที่มีอยู่อย่างต่อเนื่องในช่วงวันที่ผ่านมา เหตุผลที่ชัดเจนคือค่าเงินดอลลาร์ลดลงหลังจากที่ Donald Trump ประกาศภาษีใหม่ต่อทุกประเทศที่ส่งออกรถยนต์ไปยังสหรัฐฯ ดังที่คาดไว้ ตลาดตอบสนองด้วยการขายดอลลาร์อีกครั้ง ครั้งนี้ค่าเงินดอลลาร์สหรัฐไม่ได้ละลาย ซึ่งบ่งบอกถึงความก้าวหน้า อย่างไรก็ตาม ประธานาธิบดีสหรัฐฯ ได้สร้างปัญหาให้กับดอลลาร์อีกครั้ง

Paolo Greco 02:47 2025-03-28 UTC+2
หากไม่สะดวกคุยในตอนนี้
ระบุคำถามไว้ได้ใน แชท.
Widget callback
 

Dear visitor,

Your IP address shows that you are currently located in the USA. If you are a resident of the United States, you are prohibited from using the services of InstaFintech Group including online trading, online transfers, deposit/withdrawal of funds, etc.

If you think you are seeing this message by mistake and your location is not the US, kindly proceed to the website. Otherwise, you must leave the website in order to comply with government restrictions.

Why does your IP address show your location as the USA?

  • - you are using a VPN provided by a hosting company based in the United States;
  • - your IP does not have proper WHOIS records;
  • - an error occurred in the WHOIS geolocation database.

Please confirm whether you are a US resident or not by clicking the relevant button below. If you choose the wrong option, being a US resident, you will not be able to open an account with InstaForex anyway.

We are sorry for any inconvenience caused by this message.