empty
28.12.2022 01:53 PM
U.S. Stock Market Analysis on 27th December and 23rd December Post Market Review

U.S. markets are closed on Monday in observance of Christmas Day, which falls on Sunday. U.S. indices were up on Friday, while the inflation data released on Friday is being accessed as the market diverges in outlook vs the Fed. The Dow Jones was up 0.53% to 33,203.93, the S&P500 rose 0.59% to 3,844.82, and the NASDAQ was up 0.21% to 10,497.86. At the same time, oil prices jumped.

Notable News

  • China to scrap Covid quarantine rule for inbound travelers from Jan 8
  • US Core PCE Price Index +0.2% M/M, matching estimates; Consumer spending stagnated at +0.1% M/M - weakest since Jul-22 and below 0.2% forecast
  • Uni of Michigan Consumer Sentiment Index rose to 59.7, up from Oct's 56.8, helped by easing inflation pressures
  • US new home sales unexpected rose for second month
  • BOJ's Kuroda dismisses near-term chance of exiting easy policy

What To Watch This Week

  • Japan - Unemployment, Retail Sales (Tuesday), Industrial Production (Wednesday)
  • China - Industrial Profits (Tuesday), Manufacturing PMI (Saturday)
  • US - Goods Trade Balance, Retail Inventories (27th), Pending Home Sales (Wednesday), Initial Jobless Claims (Thursday)
  • UK - Nationwide Housing Pries (Friday)
  • At home, PPI (Thursday), Money Supply (Friday) are due

Long-term view on market and 2023 outlook:

In general, investors are still concerned about the market outlook and the fears are increasing. The economic recession seems inevitable, as major monetary authorities are determined to continue to battle high inflation. In my view, monetary policy will turn accommodative as inflation trends down. Growth pressures still weigh on developed markets' equity in 1Q 2023, but a turn in monetary policy will provide liquidity support to asset prices. Consensus expects interest rates to peak around 5.0% in the middle of 2023, which indicates it is closer to the end of the hiking cycle. I remain cautious on U.S. equities into 1Q 2023, and I believe the market will be more positive as markets bottom out in 2Q 2023.

27th December trading analysis

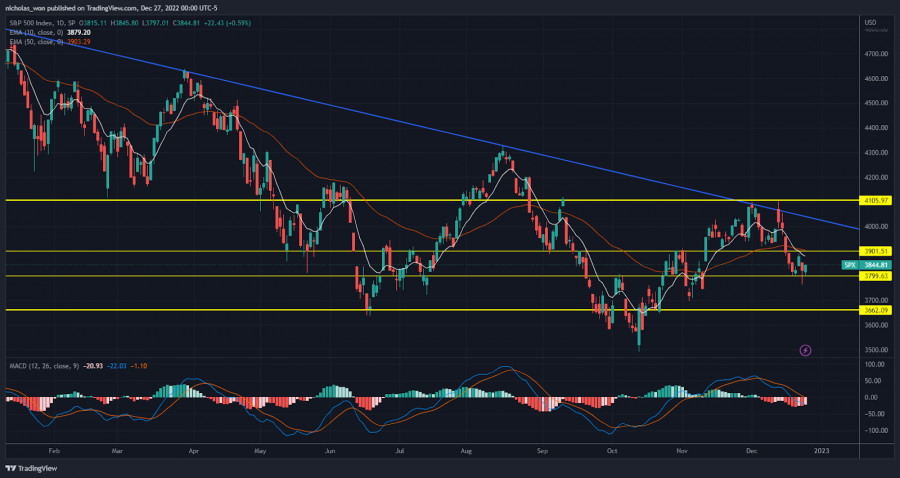
S&P 500 daily chart:

This image is no longer relevant

The S&P 500 index finished higher in a turbulent pre-holiday session Friday, as an inflation report and a slew of other data did nothing to change views that the Federal Reserve would likely keep raising interest rates even if the economy slowed. From the daily chart, the price is hovering between $3,784 support level and $3,947 resistance level. It is crucial to continue to watch the price movement in these few days to see whether the bull traders will successfully break through the $3,947 resistance level and push it to the next support level at around $4,072, or the bear traders will pull the price to the $3,784 support line and continue fall to the $3,662 support line. Traders may find an opportunity to trade between $3,784 and $3,947 as the index already traded in this range for a few days. Nonetheless, given the Fed would likely continue to raise the interest rate and the index is still trading below its 10MA and 50MA lines, I suggest traders remain cautious.

เลือกช่วงเวลา
5
นาที
15
นาที
30
นาที
1
ชั่วโมง
4
ชั่วโมง
1
วัน
1
สัปดาห์
รับผลกำไรจากการเปลี่ยนแปลงอัตราสกุลเงินดิจิทัลกับ InstaForex.
ดาวน์โหลด MetaTrader 4 และเปิดการซื้อขายครั้งแรกของคุณ.
วิเคราะห์ EUR/USD – วันที่ 5 พฤษภาคม: ภาษีใหม่ของทรัมป์ล้มเหลวในการสร้างความประทับใจ โครงสร้างคลื่นในแผนภูมิ 4 ชั่วโมงสำหรับคู่สกุลเงิน EUR/USD ได้เปลี่ยนเป็นแนวโน้มแบบกระทิง ฉันเชื่อว่าไม่มีข้อสงสัยว่าการเปลี่ยนแปลงนี้เป็นไปได้อย่างสมบูรณ์เนื่องจากนโยบายการค้าใหม่ของสหรัฐอเมริกา จนกระทั่งถึงวันที่ 28 กุมภาพันธ์ เมื่อสกุลเงินดอลลาร์สหรัฐเริ่มต้นการลดลงอย่างรวดเร็ว โครงสร้างคลื่นทั้งหมดดูเหมือนจะเป็นแนวโน้มขาลงที่น่าเชื่อถือโดยสร้างคลื่นแก้ไขที่ 2 แต่การประกาศอัตราภาษีต่าง ๆ อย่างถี่ถ้วนของทรัมป์ทุกสัปดาห์ได้มีผลกระทบอย่างมาก
  • Grand Choice
    Contest by
    InstaForex
    InstaForex always strives to help you
    fulfill your biggest dreams.
    เข้าร่วมการแข่งขัน


บทความแนะนำ

EUR/USD: ผลการประชุมของ Fed อาจทำให้คู่สกุลเงินนี้ร่วงลง

คู่สกุลกำลังเคลื่อนไหวในกรอบแคบๆ ใต้ระดับแนวต้านที่ 1.1345 รอคอยผลการประชุมนโยบายการเงินของ Fed ซึ่งจะสรุปในวันพุธที่ 7 พฤษภาคม หาก Fed ตัดสินใจคงอัตราดอกเบี้ยหลักไว้ตามที่คาดการณ์ไว้ในขณะนี้ และแสดงความสงสัยเกี่ยวกับความเป็นไปได้ในการลดอัตราดอกเบี้ยในเดือนมิถุนายน คู่สกุลนี้อาจถูกกดดันและลดลงได้ ในแง่ของเทคนิค คู่สกุลนี้กำลังเคลื่อนไหวในกรอบด้านข้างระหว่าง

Pati Gani 10:59 2025-05-05 UTC+2

EUR/USD – 5 พฤษภาคม: ตลาดแรงงานสหรัฐฯ ยังคงมีความหวัง

เมื่อวันศุกร์ คู่ EUR/USD ขยับขึ้นไปถึงระดับ 1.1374 แล้วดีดตัวออกมา กลับเป็นการเสริมค่าให้กับดอลลาร์สหรัฐอีกครั้ง ฝ่ายหมีจู่โจมอีกครั้ง แต่เพียงระยะเวลาสั้น ๆ และโดยรวมแล้วพวกเขายังคงค่อนข้างอ่อนแอ ดังนั้น ตามสถานการณ์ปัจจุบัน แนวโน้มขาขึ้นยังคงอยู่ การดีดตัวใหม่จากระดับ

Samir Klishi 10:57 2025-05-05 UTC+2

GBP/USD – 5 พฤษภาคม: ทรัมป์อาจยกเลิกการเก็บภาษีกับจีน

ในกราฟรายชั่วโมง คู่สกุลเงิน GBP/USD ได้ลดลงต่อในวันศุกร์มุ่งหน้าสู่ระดับการปรับฐาน Fibonacci 161.8% ที่ 1.3249 การดีดตัวจากระดับนี้จะเป็นประโยชน์ต่อปอนด์อังกฤษและอาจนำไปสู่การเติบโตบางส่วนไปสู่ระดับ 1.3357 การปิดต่ำกว่าระดับ 1.3249 จะเพิ่มโอกาสในการลดลงต่อไปยังระดับ 1.3149 แนวโน้มขาขึ้นยังคงอยู่ในปัจจุบัน

Samir Klishi 10:51 2025-05-05 UTC+2

คาดการณ์ตลาด Forex วันที่ 05/05/2025: EUR/USD, GBP/USD, USD/JPY, USD/CHF, USD/CAD และ Bitcoin

ลิงก์ที่เป็นประโยชน์: บทความอื่นๆ ของฉันสามารถอ่านได้ในส่วนนี้ คอร์ส InstaForex สำหรับผู้เริ่มต้น การวิเคราะห์ยอดนิยม เปิดบัญชีการซื้อขาย สำคัญ: ผู้เริ่มต้นในตลาดซื้อขาย Forex ต้องระมัดระวังในการตัดสินใจเข้าตลาดเป็นอย่างมาก ก่อนการประกาศรายงานสำคัญ ควรหลีกเลี่ยงการเข้าตลาด เพื่อหลีกเลี่ยงการถูกจับอยู่ในสภาวะตลาดที่มีการแกว่งตัวรุนแรงเนื่องจากความผันผวนที่เพิ่มขึ้น

Sebastian Seliga 10:23 2025-05-05 UTC+2

การวิเคราะห์ทางเทคนิคของการเคลื่อนไหวของราคาภายในวันของเครื่องมือสินค้าโภคภัณฑ์ทองคำ, วันจันทร์ที่ 5 พฤษภาคม 2025

เมื่อปรากฏรูปแบบ Failing Wedge ในกราฟ 4 ชั่วโมง มันบ่งบอกว่าในอนาคตอันใกล้มีศักยภาพที่จะพุ่งไปสู่ระดับ 3297.43 และหากโมเมนตัมและความผันผวนอำนวย, ราคาทองคำจะเสริมความแข็งแกร่งอีกครั้งไปสู่ระดับ 3343.81 แต่หากในระหว่างทางไปสู่ระดับเหล่านี้ เกิดการแก้ไขการอ่อนตัวที่พุ่งผ่านและปิดต่ำกว่าระดับ 3201.44 ก็จะทำให้แผนการเสริมความแข็งแกร่งที่ได้กล่าวไว้ก่อนหน้าถูกยกเลิกและถือว่าเป็นโมฆะเองโดยอัตโนมัติ

Arief Makmur 08:23 2025-05-05 UTC+2

การวิเคราะห์ทางเทคนิคของการเคลื่อนไหวของราคาภายในวันสำหรับคู่สกุลเงินข้าม EUR/JPY, วันจันทร์ที่ 5 พฤษภาคม 2025

หากพิจารณากราฟ 4 ชั่วโมงของคู่เงิน EUR/JPY ดูเหมือนว่าในอนาคตอันใกล้ EUR/JPY มีแนวโน้มที่จะแข็งค่าขึ้น ซึ่งได้รับการยืนยันจากการปรากฏของรูปแบบ Convergence ระหว่างการเคลื่อนไหวของราคาคู่เงิน EUR/JPY กับตัวชี้วัด Stochastic Oscillator และการเคลื่อนไหวของราคาคู่เงิน

Arief Makmur 08:23 2025-05-05 UTC+2

การวิเคราะห์ทางเทคนิคการเคลื่อนไหวของราคารายวัน ดัชนี Nasdaq 100 วันศุกร์ที่ 2 พฤษภาคม 2025

จากที่เห็นในกราฟ 4 ชั่วโมงของดัชนี Nasdaq 100 ตัวชี้วัด Stochastic Oscillator อยู่ในสภาวะขาย (Crossing SELL) และปรากฏรูปแบบ Rising Wedge ดังนั้นตามเงื่อนไขสองข้อนี้

Arief Makmur 08:04 2025-05-02 UTC+2

สัญญาณการซื้อขายสำหรับทองคำ (XAU/USD) สำหรับวันที่ 1-3 พฤษภาคม 2025: ซื้อเมื่อราคาสูงกว่า $3,203 (200 EMA - 5/8 Murray)

ในช่วงต้นของตลาดอเมริกา ราคาทองคำซื้อขายอยู่ที่ประมาณ 3,223 ปรับตัวขึ้นหลังจากที่ลงมาถึงระดับต่ำสุดของ 5/8 Murray ประมาณ 3,203 คาดว่าทองคำจะยังคงฟื้นตัวต่อไปในอีกไม่กี่ชั่วโมงข้างหน้า อย่างไรก็ตาม เราอาจคาดว่าน่าจะมีการปรับฐานเกิดขึ้น เนื่องจากราคาเครื่องมือทางเทคนิคนี้ดูเหมือนจะอยู่ในสถานะที่ขายมากเกินไป ราคาทองคำอาจซื้อขายอยู่ระหว่าง 3,203 และอาจลงมาถึงก้นช่องขาลงที่ประมาณ

Dimitrios Zappas 17:49 2025-05-01 UTC+2

สัญญาณการเทรด EUR/USD สำหรับวันที่ 30 เมษายน 2025: ขายต่ำกว่า 1.1376 (21 SMA - 7/8 Murray)

ในช่วงต้นของตลาดอเมริกา คู่สกุลเงิน EUR/USD กำลังซื้อขายอยู่ที่ประมาณ 1.1378 ภายในช่องแนวโน้มขาลงที่เกิดขึ้นเมื่อวันที่ 17 เมษายน และแสดงสัญญาณของการหมดพลังของแนวโน้มขาขึ้น มีความเป็นไปได้ที่จะเกิดการปรับฐานทางเทคนิคในอีกไม่กี่ชั่วโมงข้างหน้า และค่าเงินยูโรอาจร่วงลงไปยังจุดต่ำสุดของช่องแนวโน้มประมาณ 1.1150 ค่าเงินยูโรคงตัวอยู่หลายวันรอบๆ บริเวณ 1.1370

Dimitrios Zappas 17:37 2025-04-30 UTC+2

การพยากรณ์ตลาด Forex วันที่ 30/04/2025: EUR/USD, AUD/USD, USD/JPY, ราคาทองคำ และ Bitcoin

ลิงก์ที่มีประโยชน์: บทความอื่นๆของฉันสามารถหาอ่านได้ในส่วนนี้ คอร์ส InstaForex สำหรับผู้เริ่มต้น การวิเคราะห์ยอดนิยม เปิดบัญชีซื้อขาย สำคัญ: ผู้เริ่มต้นในตลาดฟอเร็กซ์จำเป็นต้องระมัดระวังเป็นอย่างยิ่งเมื่อตัดสินใจเข้าสู่ตลาด ก่อนการรายงานข้อมูลสำคัญควรหลีกเลี่ยงการเข้าตลาดเพื่อป้องกันการเผชิญกับความผันผวนที่เพิ่มขึ้นในตลาด ซึ่งอาจทำให้เกิดความผันผวนของราคาอย่างรุนแรง หากคุณตัดสินใจที่จะซื้อขายในช่วงที่มีการประกาศข่าว ควรตั้งคำสั่งหยุดขาดทุนเสมอเพื่อที่จะลดการสูญเสียให้น้อยที่สุด ถ้าไม่ได้ตั้งคำสั่งหยุดขาดทุน คุณอาจสูญเสียเงินฝากทั้งหมดได้อย่างรวดเร็ว

Sebastian Seliga 16:31 2025-04-30 UTC+2
หากไม่สะดวกคุยในตอนนี้
ระบุคำถามไว้ได้ใน แชท.
Widget callback
 

Dear visitor,

Your IP address shows that you are currently located in the USA. If you are a resident of the United States, you are prohibited from using the services of InstaFintech Group including online trading, online transfers, deposit/withdrawal of funds, etc.

If you think you are seeing this message by mistake and your location is not the US, kindly proceed to the website. Otherwise, you must leave the website in order to comply with government restrictions.

Why does your IP address show your location as the USA?

  • - you are using a VPN provided by a hosting company based in the United States;
  • - your IP does not have proper WHOIS records;
  • - an error occurred in the WHOIS geolocation database.

Please confirm whether you are a US resident or not by clicking the relevant button below. If you choose the wrong option, being a US resident, you will not be able to open an account with InstaForex anyway.

We are sorry for any inconvenience caused by this message.