

signal strength 1 of 5
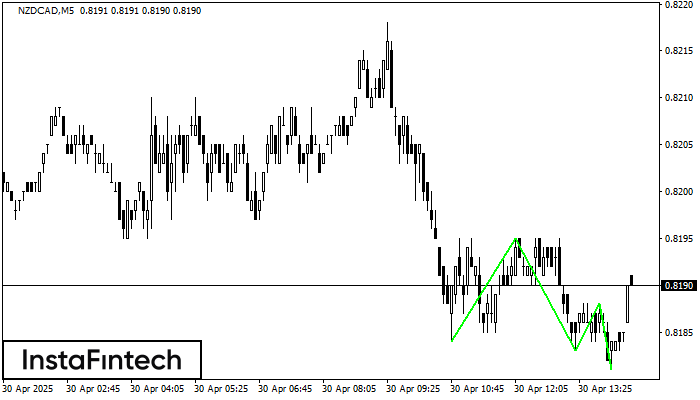
The Triple Bottom pattern has formed on the chart of the NZDCAD M5 trading instrument. The pattern signals a change in the trend from downwards to upwards in the case of breakdown of 0.8195/0.8188.
The M5 and M15 time frames may have more false entry points.
Vea asimismo
- All
- Double Top
- Flag
- Head and Shoulders
- Pennant
- Rectangle
- Triangle
- Triple top
- All
- #AAPL
- #AMZN
- #Bitcoin
- #EBAY
- #FB
- #GOOG
- #INTC
- #KO
- #MA
- #MCD
- #MSFT
- #NTDOY
- #PEP
- #TSLA
- #TWTR
- AUDCAD
- AUDCHF
- AUDJPY
- AUDUSD
- EURCAD
- EURCHF
- EURGBP
- EURJPY
- EURNZD
- EURRUB
- EURUSD
- GBPAUD
- GBPCHF
- GBPJPY
- GBPUSD
- GOLD
- NZDCAD
- NZDCHF
- NZDJPY
- NZDUSD
- SILVER
- USDCAD
- USDCHF
- USDJPY
- USDRUB
- All
- M5
- M15
- M30
- H1
- D1
- All
- Buy
- Sale
- All
- 1
- 2
- 3
- 4
- 5
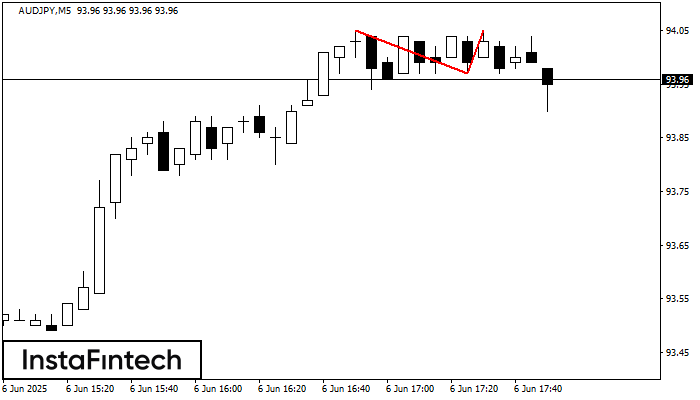
The Double Top pattern has been formed on AUDJPY M5. It signals that the trend has been changed from upwards to downwards. Probably, if the base of the pattern 93.97
The M5 and M15 time frames may have more false entry points.
Open chart in a new window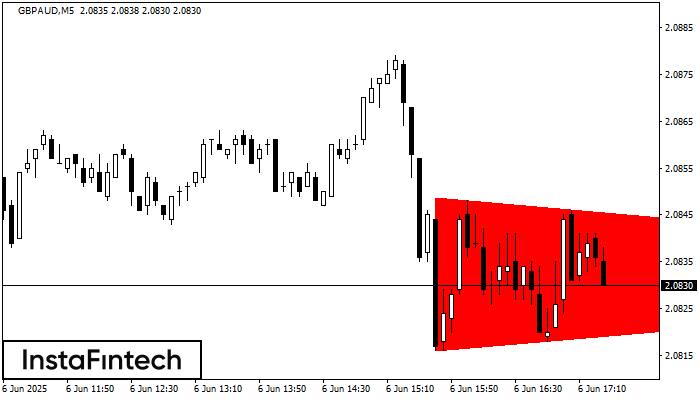
According to the chart of M5, GBPAUD formed the Bearish Symmetrical Triangle pattern. Trading recommendations: A breach of the lower border 2.0816 is likely to encourage a continuation
The M5 and M15 time frames may have more false entry points.
Open chart in a new window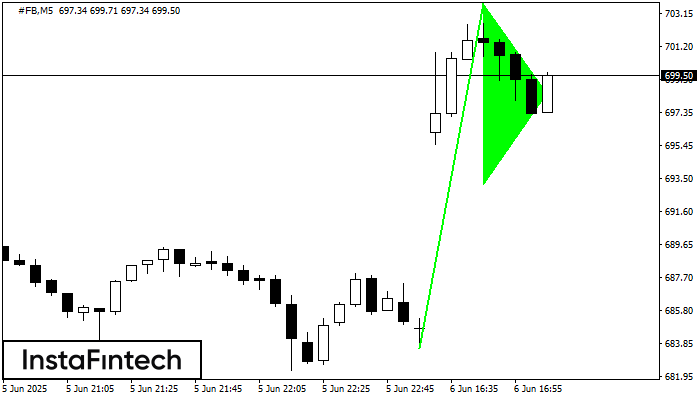
The Bullish pennant pattern is formed on the #FB M5 chart. It is a type of the continuation pattern. Supposedly, in case the price is fixed above the pennant’s high
The M5 and M15 time frames may have more false entry points.
Open chart in a new window


