


signal strength 2 of 5
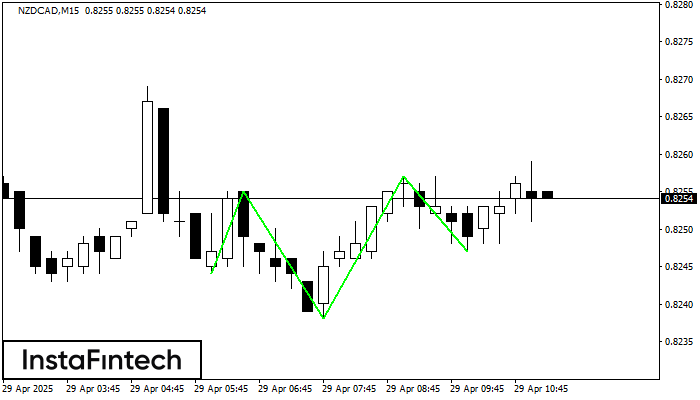
According to the chart of M15, NZDCAD formed the Inverse Head and Shoulder pattern. The Head’s top is set at 0.8257 while the median line of the Neck is found at 0.8238/0.8247. The formation of the Inverse Head and Shoulder pattern evidently signals a reversal of the downward trend. In other words, in case the scenario comes true, the price of NZDCAD will go towards 0.8280
The M5 and M15 time frames may have more false entry points.
Vea asimismo
- All
- Double Top
- Flag
- Head and Shoulders
- Pennant
- Rectangle
- Triangle
- Triple top
- All
- #AAPL
- #AMZN
- #Bitcoin
- #EBAY
- #FB
- #GOOG
- #INTC
- #KO
- #MA
- #MCD
- #MSFT
- #NTDOY
- #PEP
- #TSLA
- #TWTR
- AUDCAD
- AUDCHF
- AUDJPY
- AUDUSD
- EURCAD
- EURCHF
- EURGBP
- EURJPY
- EURNZD
- EURRUB
- EURUSD
- GBPAUD
- GBPCHF
- GBPJPY
- GBPUSD
- GOLD
- NZDCAD
- NZDCHF
- NZDJPY
- NZDUSD
- SILVER
- USDCAD
- USDCHF
- USDJPY
- USDRUB
- All
- M5
- M15
- M30
- H1
- D1
- All
- Buy
- Sale
- All
- 1
- 2
- 3
- 4
- 5
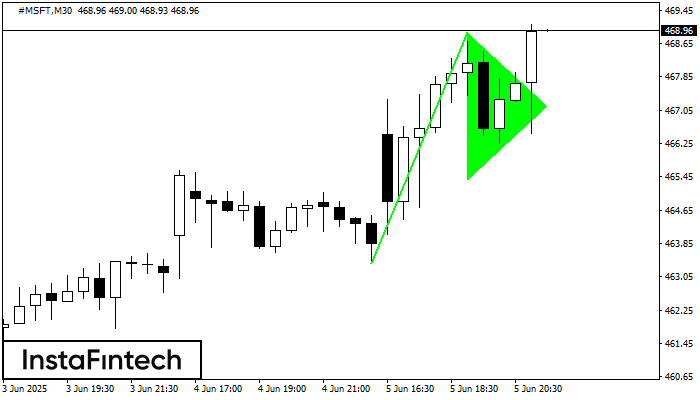
El patrón gráfico Banderín alcista se ha formado en el instrumento #MSFT M30. Este tipo de patrón entra en la categoría de patrones de continuación. En este caso
Open chart in a new window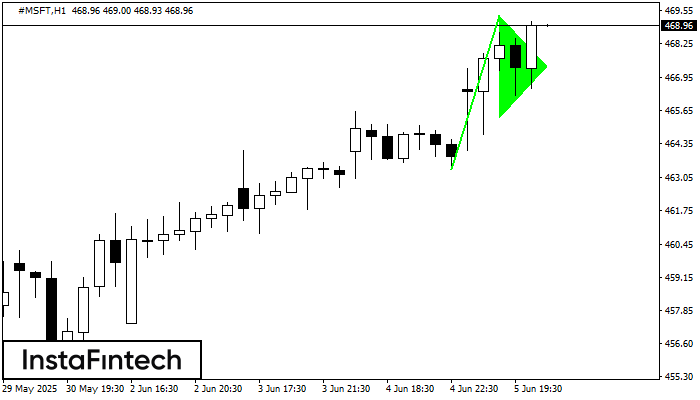
El patrón Banderín alcista está formado en el gráfico #MSFT H1. Este es un tipo de patrón de continuación. Supuestamente, en caso de que el precio se fije por encima
Open chart in a new window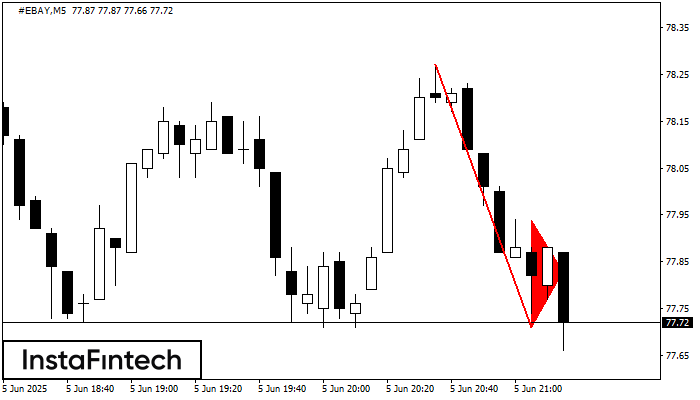
El patrón Banderín bajista se ha formado en el gráfico #EBAY M5. Este tipo de patrón se caracteriza por una ligera disminución después de lo cual el precio se moverá
Los marcos de tiempo M5 y M15 pueden tener más puntos de entrada falsos.
Open chart in a new window


