


signal strength 2 of 5
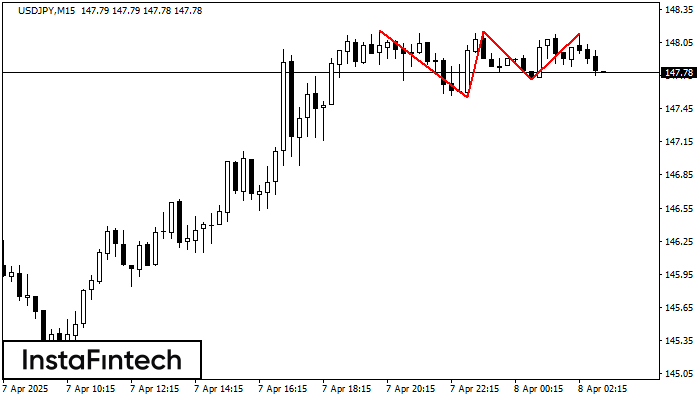
The Triple Top pattern has formed on the chart of the USDJPY M15 trading instrument. It is a reversal pattern featuring the following characteristics: resistance level 3, support level -17, and pattern’s width 61. Forecast If the price breaks through the support level 147.55, it is likely to move further down to 147.93.
The M5 and M15 time frames may have more false entry points.
Vea asimismo
- All
- Double Top
- Flag
- Head and Shoulders
- Pennant
- Rectangle
- Triangle
- Triple top
- All
- #AAPL
- #AMZN
- #Bitcoin
- #EBAY
- #FB
- #GOOG
- #INTC
- #KO
- #MA
- #MCD
- #MSFT
- #NTDOY
- #PEP
- #TSLA
- #TWTR
- AUDCAD
- AUDCHF
- AUDJPY
- AUDUSD
- EURCAD
- EURCHF
- EURGBP
- EURJPY
- EURNZD
- EURRUB
- EURUSD
- GBPAUD
- GBPCHF
- GBPJPY
- GBPUSD
- GOLD
- NZDCAD
- NZDCHF
- NZDJPY
- NZDUSD
- SILVER
- USDCAD
- USDCHF
- USDJPY
- USDRUB
- All
- M5
- M15
- M30
- H1
- D1
- All
- Buy
- Sale
- All
- 1
- 2
- 3
- 4
- 5

On the chart of NZDCAD D1 the Double Top reversal pattern has been formed. Characteristics: the upper boundary 0.8316; the lower boundary 0.7826; the width of the pattern 490 points
Open chart in a new window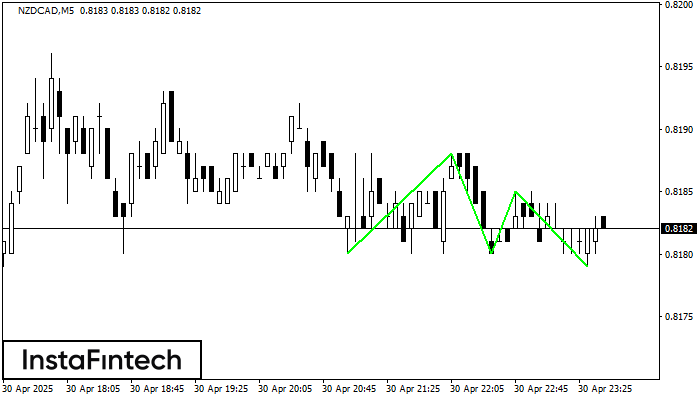
The Triple Bottom pattern has been formed on NZDCAD M5. It has the following characteristics: resistance level 0.8188/0.8185; support level 0.8180/0.8179; the width is 8 points. In the event
The M5 and M15 time frames may have more false entry points.
Open chart in a new window
According to the chart of M15, #Bitcoin formed the Bullish Symmetrical Triangle pattern. The lower border of the pattern touches the coordinates 92482.78/94081.93 whereas the upper border goes across 95186.64/94081.93
The M5 and M15 time frames may have more false entry points.
Open chart in a new window


