

signal strength 3 of 5

The Bearish pennant pattern has formed on the NZDUSD M30 chart. It signals potential continuation of the existing trend. Specifications: the pattern’s bottom has the coordinate of 0.5563; the projection of the flagpole height is equal to 29 pips. In case the price breaks out the pattern’s bottom of 0.5563, the downtrend is expected to continue for further level 0.5533.
Vea asimismo
- All
- Double Top
- Flag
- Head and Shoulders
- Pennant
- Rectangle
- Triangle
- Triple top
- All
- #AAPL
- #AMZN
- #Bitcoin
- #EBAY
- #FB
- #GOOG
- #INTC
- #KO
- #MA
- #MCD
- #MSFT
- #NTDOY
- #PEP
- #TSLA
- #TWTR
- AUDCAD
- AUDCHF
- AUDJPY
- AUDUSD
- EURCAD
- EURCHF
- EURGBP
- EURJPY
- EURNZD
- EURRUB
- EURUSD
- GBPAUD
- GBPCHF
- GBPJPY
- GBPUSD
- GOLD
- NZDCAD
- NZDCHF
- NZDJPY
- NZDUSD
- SILVER
- USDCAD
- USDCHF
- USDJPY
- USDRUB
- All
- M5
- M15
- M30
- H1
- D1
- All
- Buy
- Sale
- All
- 1
- 2
- 3
- 4
- 5
El patrón Bandera alcista ha sido formado en #PEP a M5. El límite inferior del patrón está ubicado en 135.56/135.40, mientras que el límite superior se encuentra en 135.74/135.58
Los marcos de tiempo M5 y M15 pueden tener más puntos de entrada falsos.
Open chart in a new window
El patrón Bandera alcista que señala la continuación de una tendencia ha sido formado en el gráfico #PEP M5. Pronóstico: si el precio rompe por encima del alza del patrón
Los marcos de tiempo M5 y M15 pueden tener más puntos de entrada falsos.
Open chart in a new window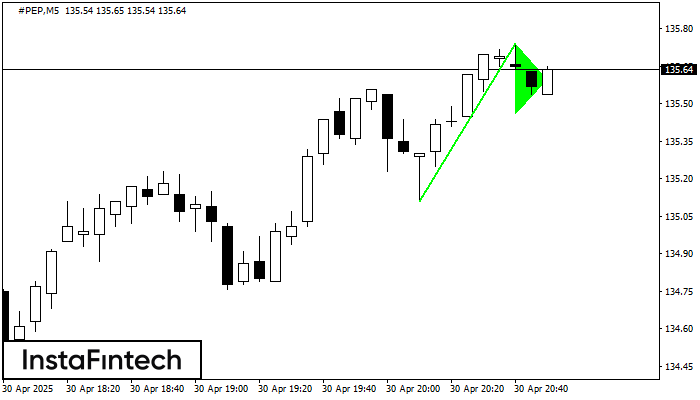
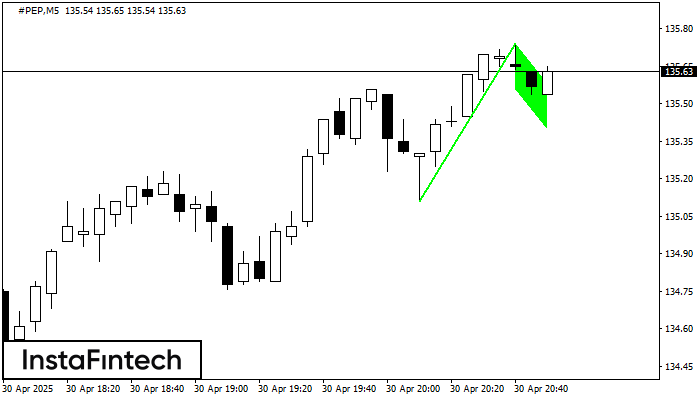
La señal Banderín alcista – Instrumento de negociación #PEP M5, patrón de continuación. Pronóstico: es posible establecer una posición de compra por encima del alza del patrón de 135.74
Los marcos de tiempo M5 y M15 pueden tener más puntos de entrada falsos.
Open chart in a new window


