

signal strength 2 of 5
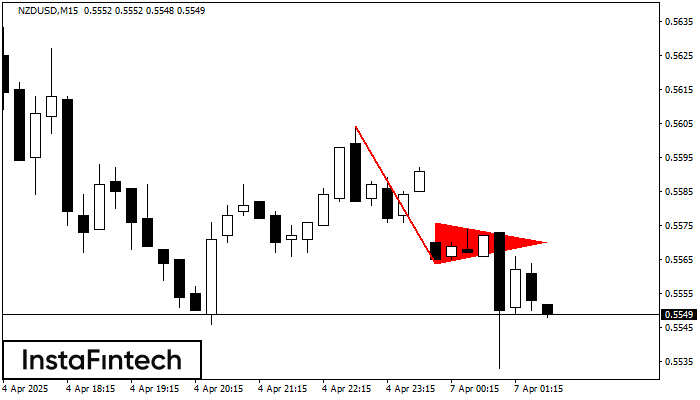
The Bearish pennant pattern has formed on the NZDUSD M15 chart. It signals potential continuation of the existing trend. Specifications: the pattern’s bottom has the coordinate of 0.5564; the projection of the flagpole height is equal to 40 pips. In case the price breaks out the pattern’s bottom of 0.5564, the downtrend is expected to continue for further level 0.5541.
The M5 and M15 time frames may have more false entry points.
Vea asimismo
- All
- Double Top
- Flag
- Head and Shoulders
- Pennant
- Rectangle
- Triangle
- Triple top
- All
- #AAPL
- #AMZN
- #Bitcoin
- #EBAY
- #FB
- #GOOG
- #INTC
- #KO
- #MA
- #MCD
- #MSFT
- #NTDOY
- #PEP
- #TSLA
- #TWTR
- AUDCAD
- AUDCHF
- AUDJPY
- AUDUSD
- EURCAD
- EURCHF
- EURGBP
- EURJPY
- EURNZD
- EURRUB
- EURUSD
- GBPAUD
- GBPCHF
- GBPJPY
- GBPUSD
- GOLD
- NZDCAD
- NZDCHF
- NZDJPY
- NZDUSD
- SILVER
- USDCAD
- USDCHF
- USDJPY
- USDRUB
- All
- M5
- M15
- M30
- H1
- D1
- All
- Buy
- Sale
- All
- 1
- 2
- 3
- 4
- 5
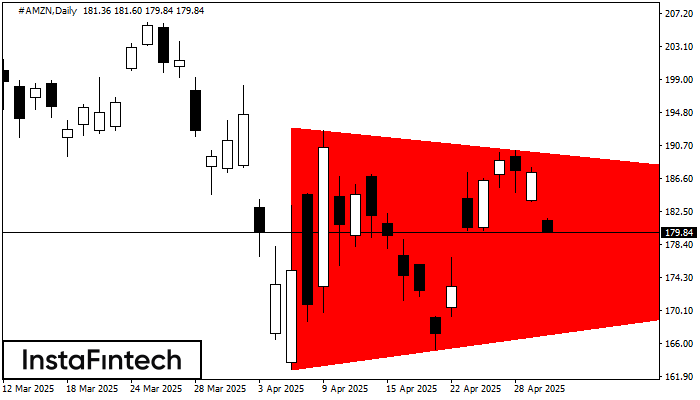
Según el gráfico de D1, el #AMZN formó el patrón Triángulo Simétrico Bajista. Este patrón señala una tendencia bajista en caso de que el límite inferior 162.77 sea roto. Aquí
Open chart in a new window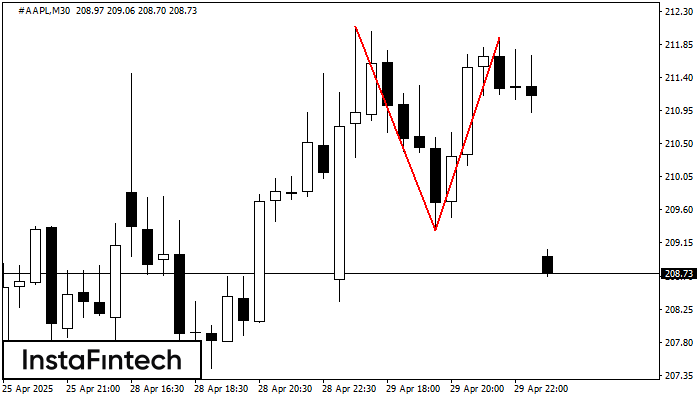
El patrón Doble Techo ha sido formado en #AAPL M30. Esto señala que la tendencia ha sido cambiada de alcista a bajista. Probablemente, si la base del patrón 209.32
Open chart in a new window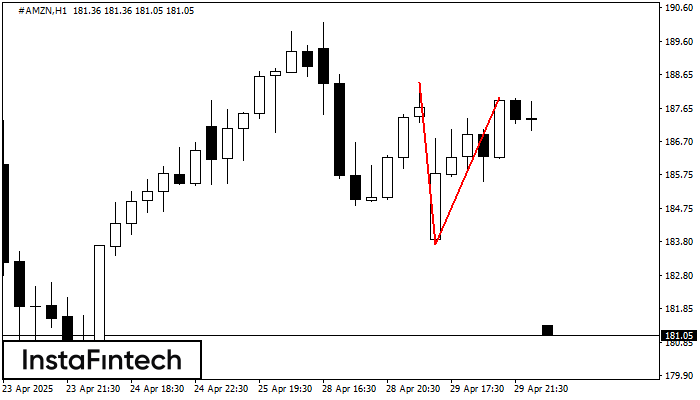
El patrón de reversión Doble Techo ha sido formado en #AMZN H1. Características: el límite superior 188.42; el límite inferior 183.71; el ancho del patrón es 426 puntos. Es mejor
Open chart in a new window


