

signal strength 1 of 5
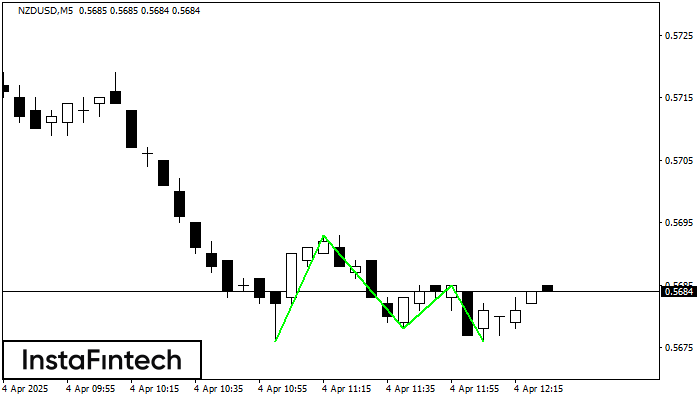
The Triple Bottom pattern has been formed on NZDUSD M5. It has the following characteristics: resistance level 0.5693/0.5685; support level 0.5676/0.5676; the width is 17 points. In the event of a breakdown of the resistance level of 0.5693, the price is likely to continue an upward movement at least to 0.5693.
The M5 and M15 time frames may have more false entry points.
Vea asimismo
- All
- Double Top
- Flag
- Head and Shoulders
- Pennant
- Rectangle
- Triangle
- Triple top
- All
- #AAPL
- #AMZN
- #Bitcoin
- #EBAY
- #FB
- #GOOG
- #INTC
- #KO
- #MA
- #MCD
- #MSFT
- #NTDOY
- #PEP
- #TSLA
- #TWTR
- AUDCAD
- AUDCHF
- AUDJPY
- AUDUSD
- EURCAD
- EURCHF
- EURGBP
- EURJPY
- EURNZD
- EURRUB
- EURUSD
- GBPAUD
- GBPCHF
- GBPJPY
- GBPUSD
- GOLD
- NZDCAD
- NZDCHF
- NZDJPY
- NZDUSD
- SILVER
- USDCAD
- USDCHF
- USDJPY
- USDRUB
- All
- M5
- M15
- M30
- H1
- D1
- All
- Buy
- Sale
- All
- 1
- 2
- 3
- 4
- 5
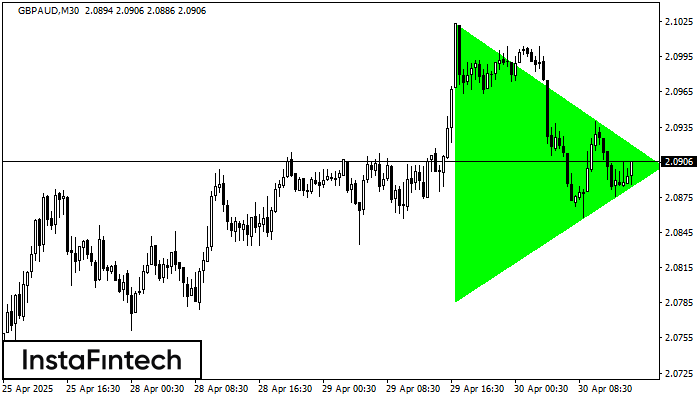
Según el gráfico de M30, el GBPAUD formó el patrón Triángulo Simétrico Alcista. El límite inferior del patrón toca las coordenadas 2.0786/2.0901 donde el límite superior cruza 2.1023/2.0901
Open chart in a new window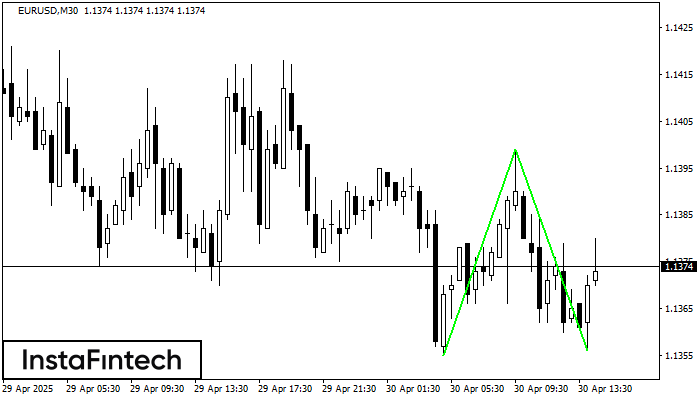
El patrón Doble Piso ha sido formado en EURUSD M30. Características: el nivel de soporte 1.1355; el nivel de resistencia 1.1399; el ancho del patrón 44 puntos. Si el nivel
Open chart in a new window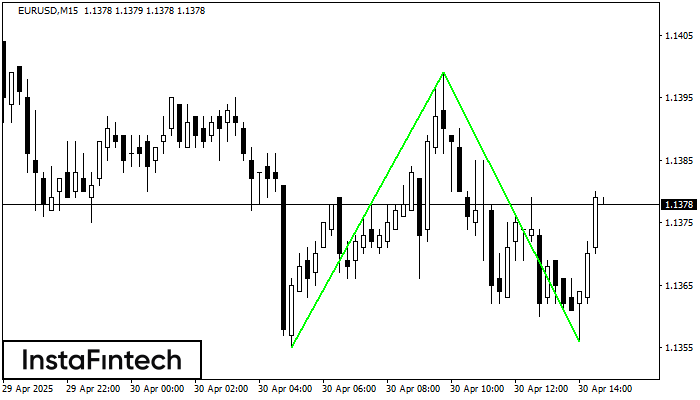
El patrón Doble Piso ha sido formado en EURUSD M15. Características: el nivel de soporte 1.1355; el nivel de resistencia 1.1399; el ancho del patrón 44 puntos. Si el nivel
Los marcos de tiempo M5 y M15 pueden tener más puntos de entrada falsos.
Open chart in a new window


