

signal strength 1 of 5
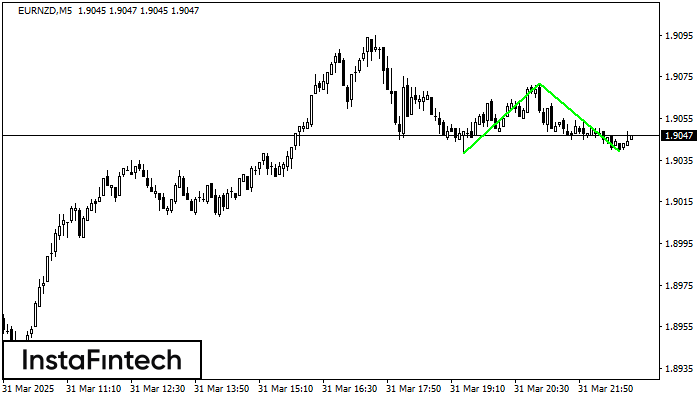
The Double Bottom pattern has been formed on EURNZD M5; the upper boundary is 1.9072; the lower boundary is 1.9039. The width of the pattern is 34 points. In case of a break of the upper boundary 1.9072, a change in the trend can be predicted where the width of the pattern will coincide with the distance to a possible take profit level.
The M5 and M15 time frames may have more false entry points.
Vea asimismo
- All
- Double Top
- Flag
- Head and Shoulders
- Pennant
- Rectangle
- Triangle
- Triple top
- All
- #AAPL
- #AMZN
- #Bitcoin
- #EBAY
- #FB
- #GOOG
- #INTC
- #KO
- #MA
- #MCD
- #MSFT
- #NTDOY
- #PEP
- #TSLA
- #TWTR
- AUDCAD
- AUDCHF
- AUDJPY
- AUDUSD
- EURCAD
- EURCHF
- EURGBP
- EURJPY
- EURNZD
- EURRUB
- EURUSD
- GBPAUD
- GBPCHF
- GBPJPY
- GBPUSD
- GOLD
- NZDCAD
- NZDCHF
- NZDJPY
- NZDUSD
- SILVER
- USDCAD
- USDCHF
- USDJPY
- USDRUB
- All
- M5
- M15
- M30
- H1
- D1
- All
- Buy
- Sale
- All
- 1
- 2
- 3
- 4
- 5
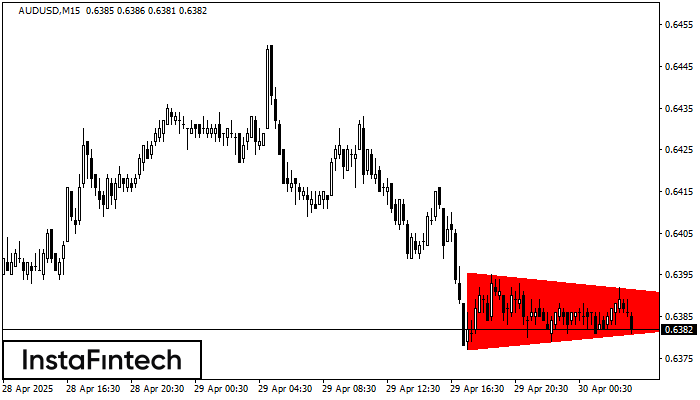
Según el gráfico de M15, el AUDUSD formó el patrón Triángulo Simétrico Bajista. Descripción: El límite inferior es 0.6377/0.6386 y el límite superior es 0.6396/0.6386. El ancho del patrón
Los marcos de tiempo M5 y M15 pueden tener más puntos de entrada falsos.
Open chart in a new window
El patrón Bandera bajista ha sido formado en el gráfico NZDCAD H1 que señala que la tendencia bajista continuará. Si el precio rompe por debajo del mínimo a 0.8194, entonces
Open chart in a new window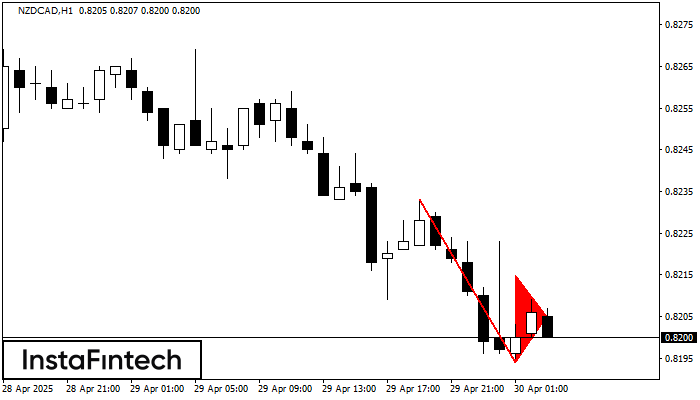
El patrón Banderín bajista se ha formado en el gráfico NZDCAD H1. El patrón señala la continuación de la tendencia bajista en caso de que se rompa el mínimo
Open chart in a new window


