The EUR/USD pair traded relatively calmly on Monday, at least during the first half of the day. However, with the opening of the U.S. session, volatility surged sharply. The subsequent movements, though, seemed to lack specific reasons or justifications. The only notable event of the day was Donald Trump's inauguration, which, frankly, appeared puzzling in terms of the excitement it generated. On one hand, this wasn't just the inauguration of any U.S. president; it was for a highly controversial leader who, over the past two months, made numerous promises to "transform the world" and "restore America's greatness." If even 25% of these promises come to fruition, the world could experience significant changes, and markets would likely respond to such an event. On the other hand, it has been known for two months that Donald Trump would be the president. So what exactly changes now that it is official?
Ultimately, the market reacted emotionally with the opening of the U.S. session, leading to a decline in the dollar. However, what justified this decline? There weren't any strong reasons behind it. Last week, the market largely overlooked a significant amount of macroeconomic data and fundamental developments, all suggesting that the dollar should continue to strengthen against the euro. It's possible that the EUR/USD pair is currently slightly oversold and needs a meaningful correction. We observed that the decline has been nearly uninterrupted for the past 3.5 months on the daily timeframe. Thus, a correction is necessary, and this might be the beginning of a proper correction.
If this is the case, the basis for the correction is primarily technical, with Trump's inauguration acting as a timely trigger. Where might the EUR/USD pair correct to? The most obvious target is the Senkou Span B line on the daily timeframe, located around 1.0635. This target is approximately 200 pips away, which fits the definition of a "correction." However, if this movement occurs, it won't signify the end of the downtrend or the beginning of sustained dollar weakness.
In summary, we remain focused on the continued decline of the euro and believe that a dip below parity is entirely plausible in 2025. Several key factors could contribute to pushing the euro lower: the European Central Bank (ECB) may reduce its interest rate to 2% by summer, with the possibility of further cuts over time. In contrast, the Federal Reserve (Fed) may only lower rates a maximum of twice throughout 2025. Therefore, we see no reason for the dollar to weaken or for the euro to strengthen.
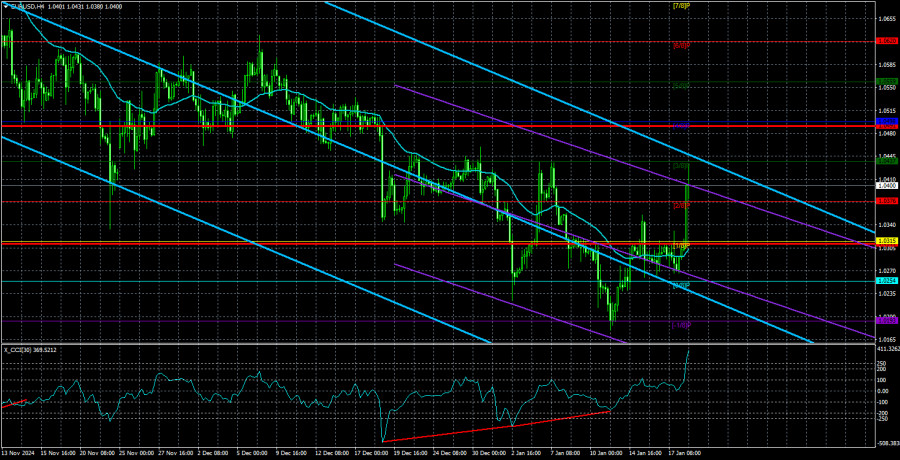
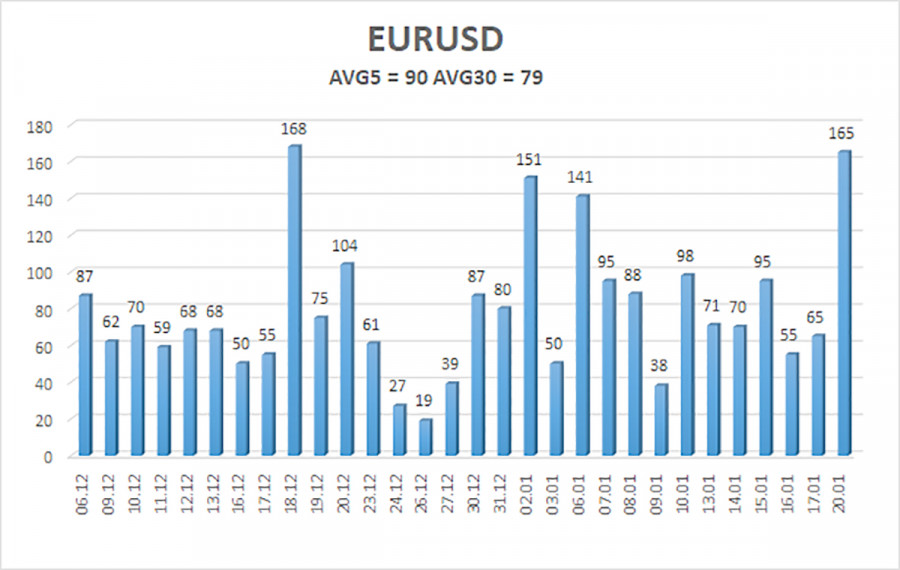
The average volatility of the EUR/USD currency pair over the last five trading days as of January 21 is 90 pips, categorized as "high." We expect the pair to move between levels 1.0311 and 1.0491 on Tuesday. The upper channel of linear regression remains downward, indicating that the global bearish trend continues. The CCI indicator has recently entered the oversold zone twice and formed two bullish divergences, but these signals only indicated a potential correction.
Nearest Support Levels:
- S1 – 1.0254
- S2 – 1.0193
- S3 – 1.0132
Nearest Resistance Levels:
- R1 – 1.0315
- R2 – 1.0376
- R3 – 1.0437
Trading Recommendations:
The EUR/USD pair is continuing its bearish trend. A new corrective wave has begun, but its timing was difficult to predict. In recent months, we have consistently indicated that we expect a medium-term decline in the euro, and we fully support this overall bearish outlook, believing it is not yet over. The Fed has paused its monetary policy easing, while the ECB is accelerating its easing measures. As a result, there are no medium-term reasons for the dollar to weaken, aside from purely technical corrections.
Short positions remain relevant, with targets set at 1.0199 and 1.0193, although these will require the current correction to complete. This correction could potentially end at around the 1.0437 level. If you are trading based purely on technical signals, long positions may be considered if the price moves above the moving average, with targets at 1.0437 and 1.0491. However, any growth at this moment should be regarded as a correction.
Explanation of Illustrations:
Linear Regression Channels help determine the current trend. If both channels are aligned, it indicates a strong trend.
Moving Average Line (settings: 20,0, smoothed) defines the short-term trend and guides the trading direction.
Murray Levels act as target levels for movements and corrections.
Volatility Levels (red lines) represent the likely price range for the pair over the next 24 hours based on current volatility readings.
CCI Indicator: If it enters the oversold region (below -250) or overbought region (above +250), it signals an impending trend reversal in the opposite direction.


