


signal strength 2 of 5
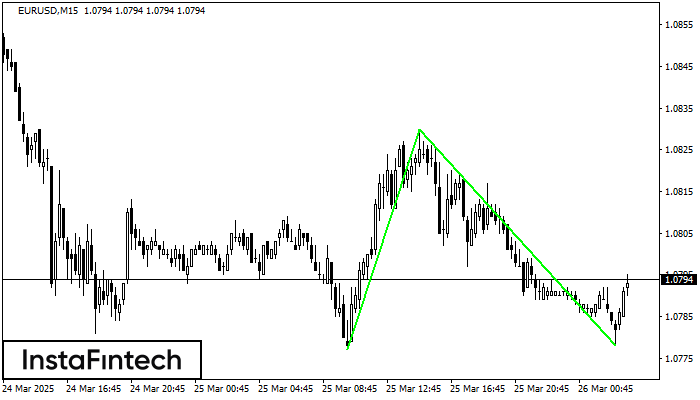
The Double Bottom pattern has been formed on EURUSD M15. This formation signals a reversal of the trend from downwards to upwards. The signal is that a buy trade should be opened after the upper boundary of the pattern 1.0830 is broken. The further movements will rely on the width of the current pattern 53 points.
The M5 and M15 time frames may have more false entry points.
- All
- Double Top
- Flag
- Head and Shoulders
- Pennant
- Rectangle
- Triangle
- Triple top
- All
- #AAPL
- #AMZN
- #Bitcoin
- #EBAY
- #FB
- #GOOG
- #INTC
- #KO
- #MA
- #MCD
- #MSFT
- #NTDOY
- #PEP
- #TSLA
- #TWTR
- AUDCAD
- AUDCHF
- AUDJPY
- AUDUSD
- EURCAD
- EURCHF
- EURGBP
- EURJPY
- EURNZD
- EURRUB
- EURUSD
- GBPAUD
- GBPCHF
- GBPJPY
- GBPUSD
- GOLD
- NZDCAD
- NZDCHF
- NZDJPY
- NZDUSD
- SILVER
- USDCAD
- USDCHF
- USDJPY
- USDRUB
- All
- M5
- M15
- M30
- H1
- D1
- All
- Buy
- Sale
- All
- 1
- 2
- 3
- 4
- 5
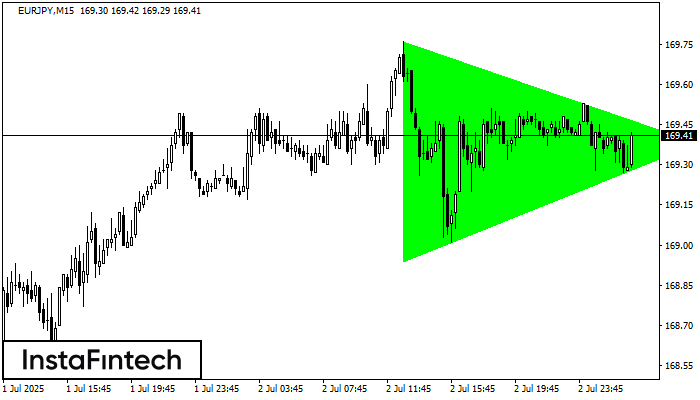
Theo biểu đồ của M15, EURJPY đã hình thành mô hình Tam giác Cân Tăng, điều mà báo hiệu xu hướng sẽ tiếp tục. Mô tả. Đường biên giới
Khung thời gian M5 và M15 có thể có nhiều điểm vào lệnh sai hơn.
Open chart in a new window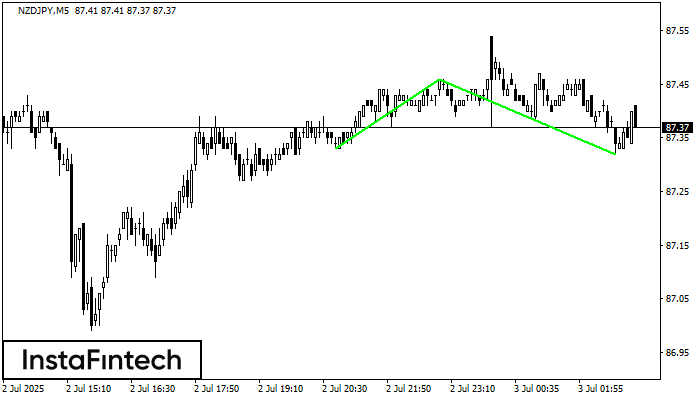
Mô hình Đáy đôi đã được hình thành trên NZDJPY M5. Đặc điểm: mức hỗ trợ 87.33; mức kháng cự 87.46; chiều rộng của mô hình 13 điểm
Khung thời gian M5 và M15 có thể có nhiều điểm vào lệnh sai hơn.
Open chart in a new window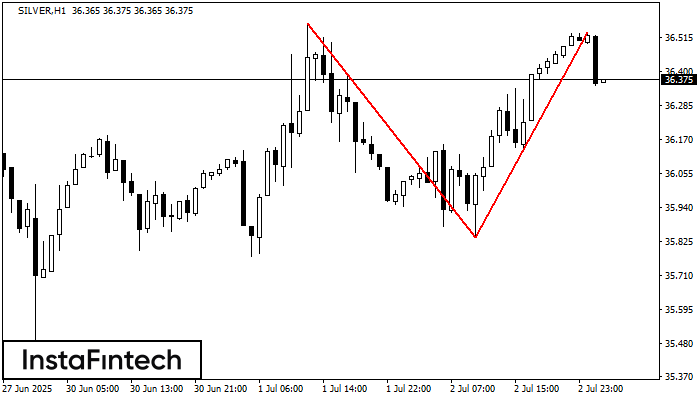
Mô hình đảo chiều Đỉnh đôi đã được hình thành trên SILVER H1. Đặc điểm: ranh giới trên 36.56; ranh giới dưới 35.84; chiều rộng của mô hình
Open chart in a new window


