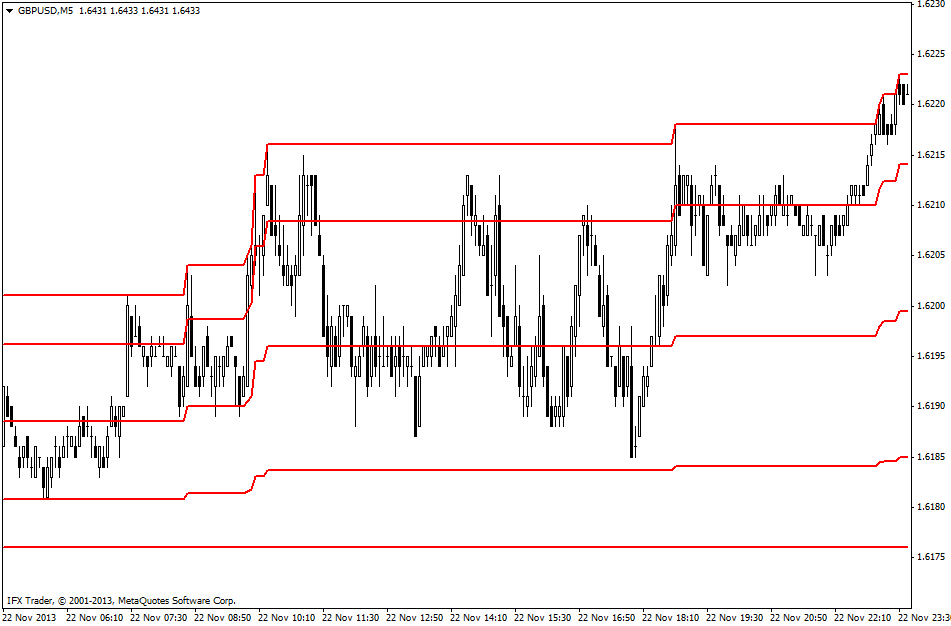
The Day Channel Indicator is a variant of the indicator calculated on the basis of the highs and lows of the previous trading day. This indicator can be applied only to the short-term time frames (from M30 and lower). It is used to identify short-term levels of support and resistance of the financial assets.
Formula
In order to calculate the indicator’s value, one has to deduct the low of the previous day from its high and the interval. The result is divided into five levels:
Line 1 – min
Line 2 – 38.2% (line 3 : line 1)
Line 3 – 50% (max : min)
Line 4 – 61.8% (line 5 : line 3)
Line 5 (max)
Trading use
The Day Channel indicator allows a user to identify relevant short-term levels of support and resistance, which a trader may use to open buy and sell deals as the levels of the indicator Day Channel for MetaTrader act as strong intraday barrier for the price.
The methodology of the calculation of Day Channel resembles the principles of calculation of many channel indicators. However, the major factor is that the indicator’s lines are built on the basis of the Fibonacci sequence and the key level is a level of Line 3 (50%) acting as pivot point.
In order to apply this indicator in trading, a trader has to realize that the Day Channel indicator is a confirming indicator pointing the spot of the price reversal. However, it does not suggest whether this reversal happens in the future. In order to increase the probability of success in trading one has to use additional methods of analysis such as candlestick charts to indicate reverse patterns on the indicator’s levels.
The strongest levels of the Day Channel are levels 1, 3 (pivot point), and 5 as the boundaries, i.e. the highs and the lows of the previous day are strong barrier for the price, especially if there is flat on the financial asset.
The levels 2 and 4 serve only as short-term support/resistance levels, where it is better to increase position size, not to open new positions when the price movement develops.


