

signal strength 2 of 5
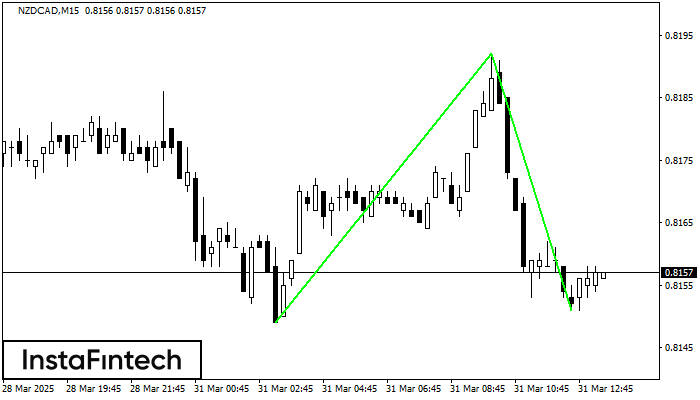
The Double Bottom pattern has been formed on NZDCAD M15. Characteristics: the support level 0.8149; the resistance level 0.8192; the width of the pattern 43 points. If the resistance level is broken, a change in the trend can be predicted with the first target point lying at the distance of 41 points.
The M5 and M15 time frames may have more false entry points.
- All
- Double Top
- Flag
- Head and Shoulders
- Pennant
- Rectangle
- Triangle
- Triple top
- All
- #AAPL
- #AMZN
- #Bitcoin
- #EBAY
- #FB
- #GOOG
- #INTC
- #KO
- #MA
- #MCD
- #MSFT
- #NTDOY
- #PEP
- #TSLA
- #TWTR
- AUDCAD
- AUDCHF
- AUDJPY
- AUDUSD
- EURCAD
- EURCHF
- EURGBP
- EURJPY
- EURNZD
- EURRUB
- EURUSD
- GBPAUD
- GBPCHF
- GBPJPY
- GBPUSD
- GOLD
- NZDCAD
- NZDCHF
- NZDJPY
- NZDUSD
- SILVER
- USDCAD
- USDCHF
- USDJPY
- USDRUB
- All
- M5
- M15
- M30
- H1
- D1
- All
- Buy
- Sale
- All
- 1
- 2
- 3
- 4
- 5
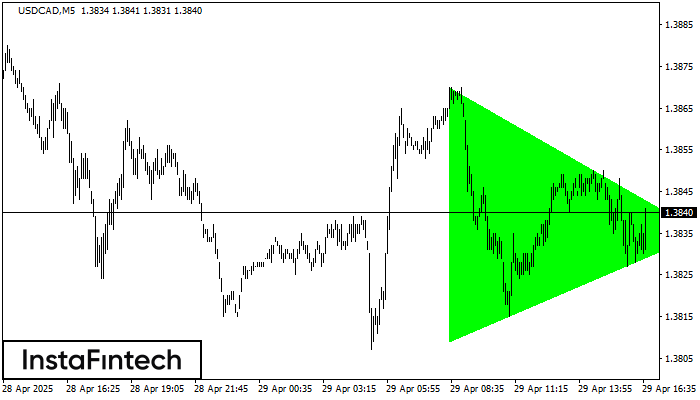
Según el gráfico de M5, el USDCAD formó el patrón Triángulo Simétrico Alcista. El límite inferior del patrón toca las coordenadas 1.3809/1.3835 donde el límite superior cruza 1.3870/1.3835
Los marcos de tiempo M5 y M15 pueden tener más puntos de entrada falsos.
Open chart in a new window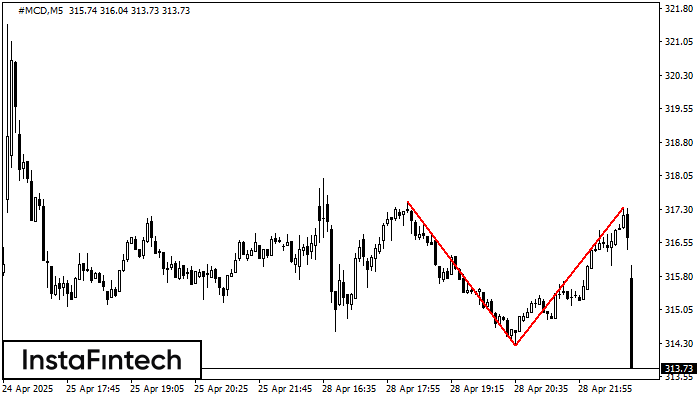
El patrón Doble Techo ha sido formado en #MCD M5. Esto señala que la tendencia ha sido cambiada de alcista a bajista. Probablemente, si la base del patrón 314.25
Los marcos de tiempo M5 y M15 pueden tener más puntos de entrada falsos.
Open chart in a new window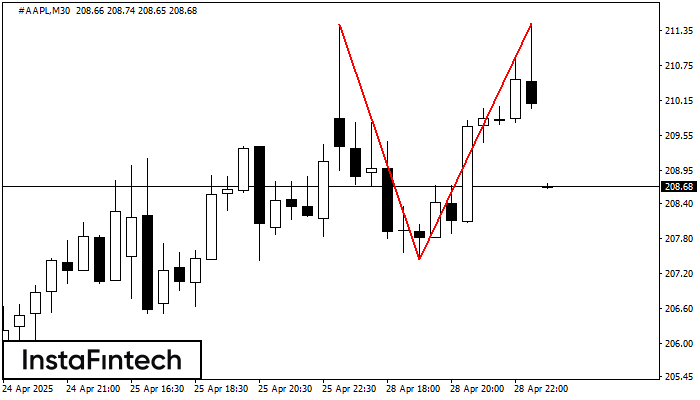
En el gráfico de #AAPL M30 el patrón de reversión Doble Techo ha sido formado. Características: límite superior 211.46; límite inferior 207.44; el ancho del patrón 402 puntos. La señal
Open chart in a new window


