

signal strength 1 of 5

The Triple Bottom pattern has formed on the chart of USDJPY M5. Features of the pattern: The lower line of the pattern has coordinates 150.29 with the upper limit 150.29/150.27, the projection of the width is 19 points. The formation of the Triple Bottom pattern most likely indicates a change in the trend from downward to upward. This means that in the event of a breakdown of the resistance level 150.10, the price is most likely to continue the upward movement.
The M5 and M15 time frames may have more false entry points.
See Also
- All
- Double Top
- Flag
- Head and Shoulders
- Pennant
- Rectangle
- Triangle
- Triple top
- All
- #AAPL
- #AMZN
- #Bitcoin
- #EBAY
- #FB
- #GOOG
- #INTC
- #KO
- #MA
- #MCD
- #MSFT
- #NTDOY
- #PEP
- #TSLA
- #TWTR
- AUDCAD
- AUDCHF
- AUDJPY
- AUDUSD
- EURCAD
- EURCHF
- EURGBP
- EURJPY
- EURNZD
- EURRUB
- EURUSD
- GBPAUD
- GBPCHF
- GBPJPY
- GBPUSD
- GOLD
- NZDCAD
- NZDCHF
- NZDJPY
- NZDUSD
- SILVER
- USDCAD
- USDCHF
- USDJPY
- USDRUB
- All
- M5
- M15
- M30
- H1
- D1
- All
- Buy
- Sale
- All
- 1
- 2
- 3
- 4
- 5
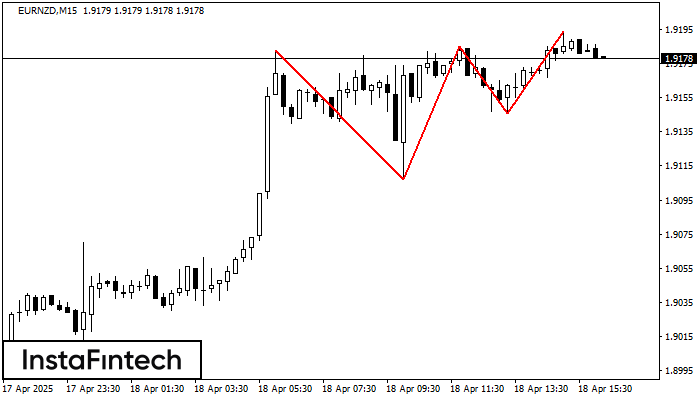
En el gráfico del instrumento de negociación EURNZD M15, se ha formado el patrón Triple Techo que señala un cambio en la tendencia. Es posible que después de la formación
Los marcos de tiempo M5 y M15 pueden tener más puntos de entrada falsos.
Open chart in a new window
Según el gráfico de M30, EURGBP formó el Rectángulo Bajista. Este tipo de patrón indica la continuación de una tendencia. Esto consiste de dos niveles: resistencia 0.8574 - 0.0000
Open chart in a new window
El patrón Triple Piso ha formado en el gráfico del instrumento de negociación NZDCAD M5. El patrón señala un cambio en la tendencia de bajista a alcista en caso
Los marcos de tiempo M5 y M15 pueden tener más puntos de entrada falsos.
Open chart in a new window


