

signal strength 1 of 5

The Triple Bottom pattern has been formed on GBPAUD M5. It has the following characteristics: resistance level 2.0835/2.0826; support level 2.0821/2.0823; the width is 14 points. In the event of a breakdown of the resistance level of 2.0835, the price is likely to continue an upward movement at least to 2.0836.
The M5 and M15 time frames may have more false entry points.
See Also
- All
- Double Top
- Flag
- Head and Shoulders
- Pennant
- Rectangle
- Triangle
- Triple top
- All
- #AAPL
- #AMZN
- #Bitcoin
- #EBAY
- #FB
- #GOOG
- #INTC
- #KO
- #MA
- #MCD
- #MSFT
- #NTDOY
- #PEP
- #TSLA
- #TWTR
- AUDCAD
- AUDCHF
- AUDJPY
- AUDUSD
- EURCAD
- EURCHF
- EURGBP
- EURJPY
- EURNZD
- EURRUB
- EURUSD
- GBPAUD
- GBPCHF
- GBPJPY
- GBPUSD
- GOLD
- NZDCAD
- NZDCHF
- NZDJPY
- NZDUSD
- SILVER
- USDCAD
- USDCHF
- USDJPY
- USDRUB
- All
- M5
- M15
- M30
- H1
- D1
- All
- Buy
- Sale
- All
- 1
- 2
- 3
- 4
- 5
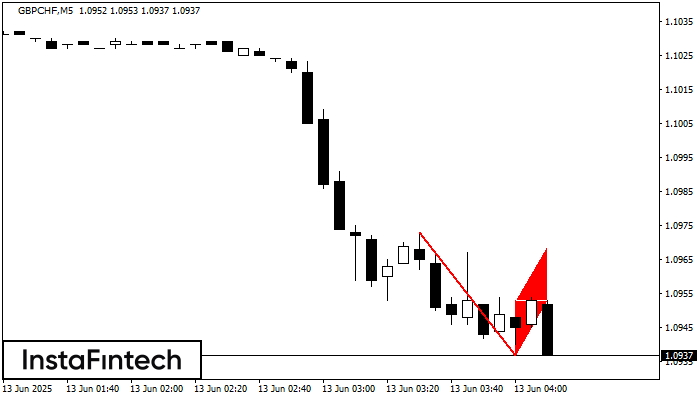
The Bearish Flag pattern has been formed on the chart GBPCHF M5. Therefore, the downwards trend is likely to continue in the nearest term. As soon as the price breaks
The M5 and M15 time frames may have more false entry points.
Open chart in a new window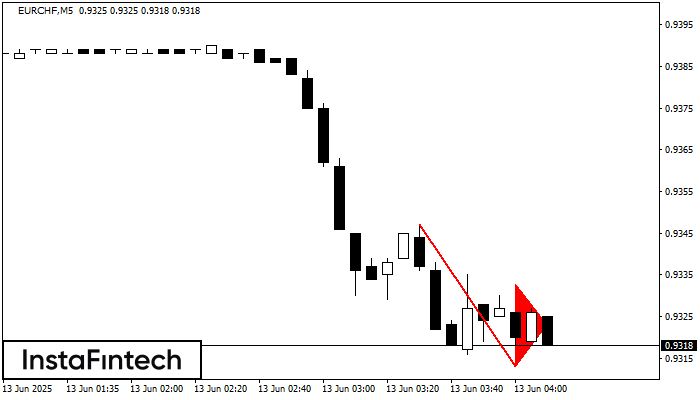
The Bearish pennant pattern has formed on the EURCHF M5 chart. The pattern signals continuation of the downtrend in case the pennant’s low of 0.9313 is broken through. Recommendations: Place
The M5 and M15 time frames may have more false entry points.
Open chart in a new window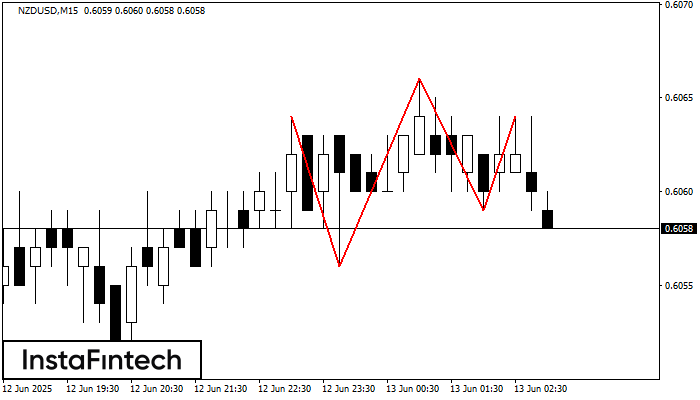
On the chart of the NZDUSD M15 trading instrument, the Triple Top pattern that signals a trend change has formed. It is possible that after formation of the third peak
The M5 and M15 time frames may have more false entry points.
Open chart in a new window


