


signal strength 2 of 5
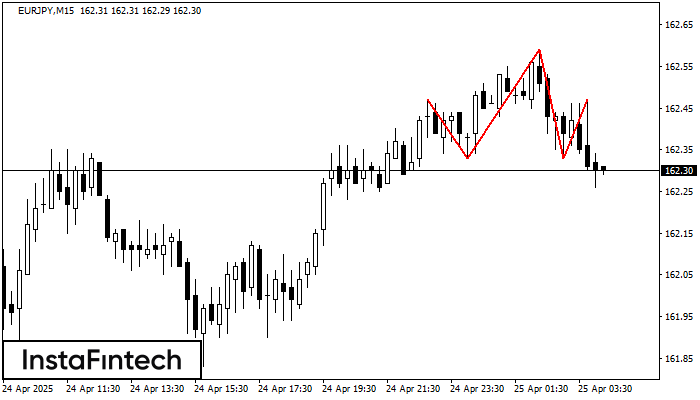
According to the chart of M15, EURJPY formed the Head and Shoulders pattern. The Head’s top is set at 162.59 while the median line of the Neck is found at 162.33/162.33. The formation of the Head and Shoulders pattern evidently signals a reversal of the upward trend. In other words, in case the scenario comes true, the price of EURJPY will go towards 162.10.
The M5 and M15 time frames may have more false entry points.
- All
- Double Top
- Flag
- Head and Shoulders
- Pennant
- Rectangle
- Triangle
- Triple top
- All
- #AAPL
- #AMZN
- #Bitcoin
- #EBAY
- #FB
- #GOOG
- #INTC
- #KO
- #MA
- #MCD
- #MSFT
- #NTDOY
- #PEP
- #TSLA
- #TWTR
- AUDCAD
- AUDCHF
- AUDJPY
- AUDUSD
- EURCAD
- EURCHF
- EURGBP
- EURJPY
- EURNZD
- EURRUB
- EURUSD
- GBPAUD
- GBPCHF
- GBPJPY
- GBPUSD
- GOLD
- NZDCAD
- NZDCHF
- NZDJPY
- NZDUSD
- SILVER
- USDCAD
- USDCHF
- USDJPY
- USDRUB
- All
- M5
- M15
- M30
- H1
- D1
- All
- Buy
- Sale
- All
- 1
- 2
- 3
- 4
- 5
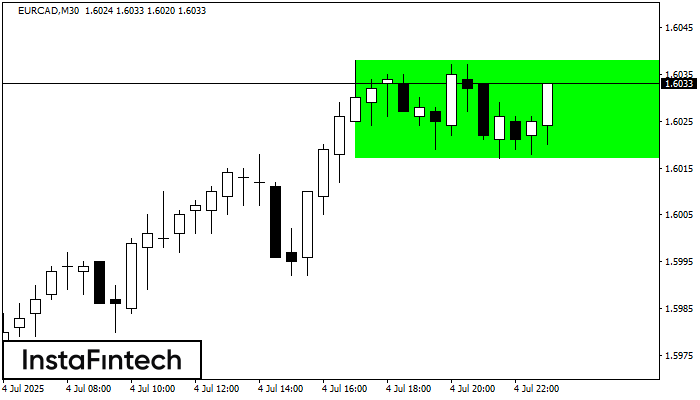
De acordo com o gráfico de M30, EURCAD formou o Retângulo de alta que é um padrão de uma continuação da tendência. O padrão está dentro dos seguintes limites
Open chart in a new window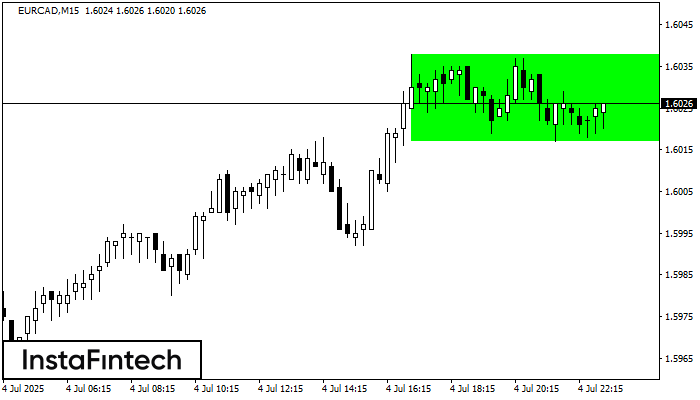
De acordo com o gráfico de M15, EURCAD formou o Retângulo de alta que é um padrão de uma continuação da tendência. O padrão está dentro dos seguintes limites
Os intervalos M5 e M15 podem ter mais pontos de entrada falsos.
Open chart in a new window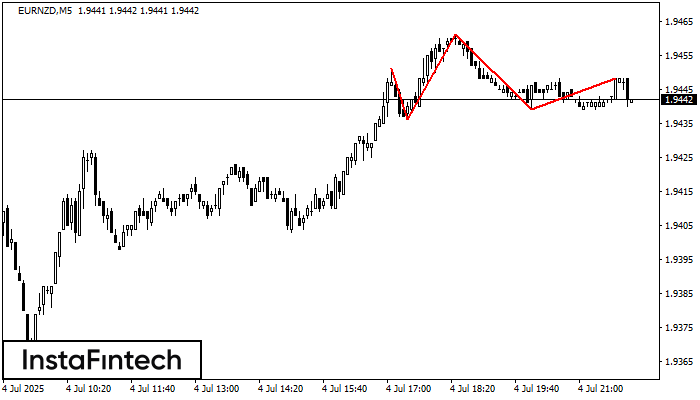
De acordo com o gráfico de M5, EURNZD formou o padrão Cabeça & Ombros. O topo da Cabeça está definido em 1.9461 enquanto a linha mediana do Pescoço é encontrada
Os intervalos M5 e M15 podem ter mais pontos de entrada falsos.
Open chart in a new window


