

signal strength 1 of 5

The Bullish pennant graphic pattern has formed on the NZDUSD M5 instrument. This pattern type falls under the category of continuation patterns. In this case, if the quote can breaks out high, is expected to continue the upward trend to level 0.6028.
The M5 and M15 time frames may have more false entry points.
Veja também
- All
- Double Top
- Flag
- Head and Shoulders
- Pennant
- Rectangle
- Triangle
- Triple top
- All
- #AAPL
- #AMZN
- #Bitcoin
- #EBAY
- #FB
- #GOOG
- #INTC
- #KO
- #MA
- #MCD
- #MSFT
- #NTDOY
- #PEP
- #TSLA
- #TWTR
- AUDCAD
- AUDCHF
- AUDJPY
- AUDUSD
- EURCAD
- EURCHF
- EURGBP
- EURJPY
- EURNZD
- EURRUB
- EURUSD
- GBPAUD
- GBPCHF
- GBPJPY
- GBPUSD
- GOLD
- NZDCAD
- NZDCHF
- NZDJPY
- NZDUSD
- SILVER
- USDCAD
- USDCHF
- USDJPY
- USDRUB
- All
- M5
- M15
- M30
- H1
- D1
- All
- Buy
- Sale
- All
- 1
- 2
- 3
- 4
- 5
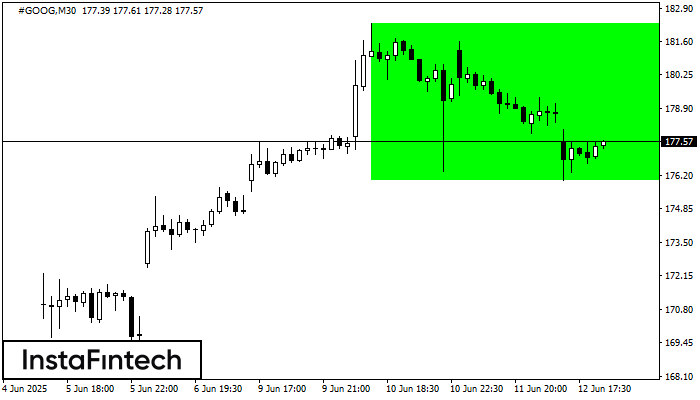
According to the chart of M30, #GOOG formed the Bullish Rectangle. The pattern indicates a trend continuation. The upper border is 182.33, the lower border is 176.00. The signal means
Открыть график инструмента в новом окне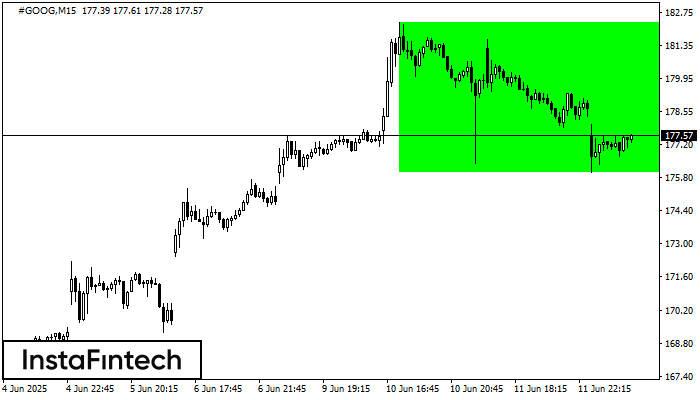
According to the chart of M15, #GOOG formed the Bullish Rectangle which is a pattern of a trend continuation. The pattern is contained within the following borders: the lower border
The M5 and M15 time frames may have more false entry points.
Открыть график инструмента в новом окне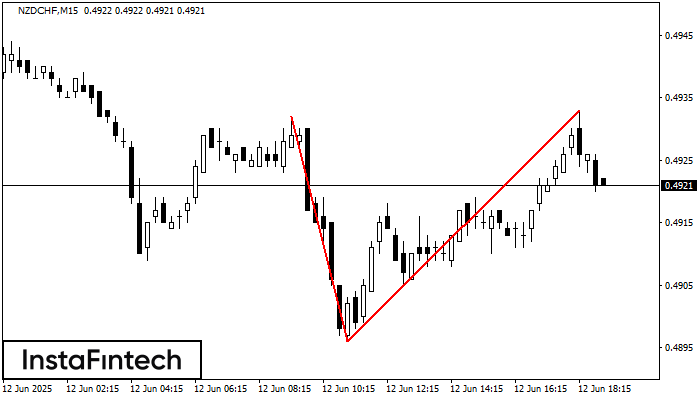
The Double Top reversal pattern has been formed on NZDCHF M15. Characteristics: the upper boundary 0.4932; the lower boundary 0.4896; the width of the pattern is 37 points. Sell trades
The M5 and M15 time frames may have more false entry points.
Открыть график инструмента в новом окне


