

signal strength 1 of 5
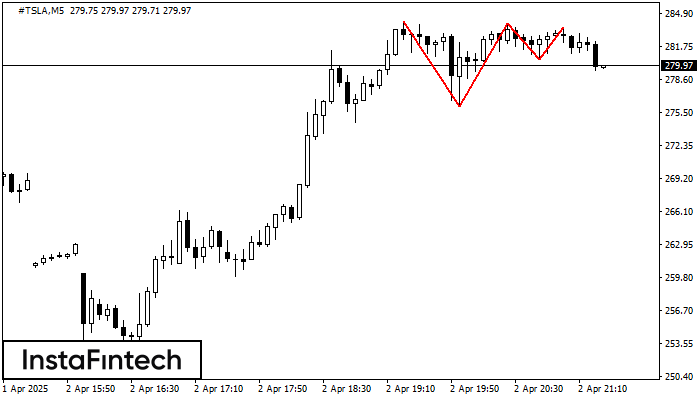
The Triple Top pattern has formed on the chart of the #TSLA M5 trading instrument. It is a reversal pattern featuring the following characteristics: resistance level 56, support level -444, and pattern’s width 805. Forecast If the price breaks through the support level 276.07, it is likely to move further down to 283.77.
The M5 and M15 time frames may have more false entry points.
Veja também
- All
- Double Top
- Flag
- Head and Shoulders
- Pennant
- Rectangle
- Triangle
- Triple top
- All
- #AAPL
- #AMZN
- #Bitcoin
- #EBAY
- #FB
- #GOOG
- #INTC
- #KO
- #MA
- #MCD
- #MSFT
- #NTDOY
- #PEP
- #TSLA
- #TWTR
- AUDCAD
- AUDCHF
- AUDJPY
- AUDUSD
- EURCAD
- EURCHF
- EURGBP
- EURJPY
- EURNZD
- EURRUB
- EURUSD
- GBPAUD
- GBPCHF
- GBPJPY
- GBPUSD
- GOLD
- NZDCAD
- NZDCHF
- NZDJPY
- NZDUSD
- SILVER
- USDCAD
- USDCHF
- USDJPY
- USDRUB
- All
- M5
- M15
- M30
- H1
- D1
- All
- Buy
- Sale
- All
- 1
- 2
- 3
- 4
- 5
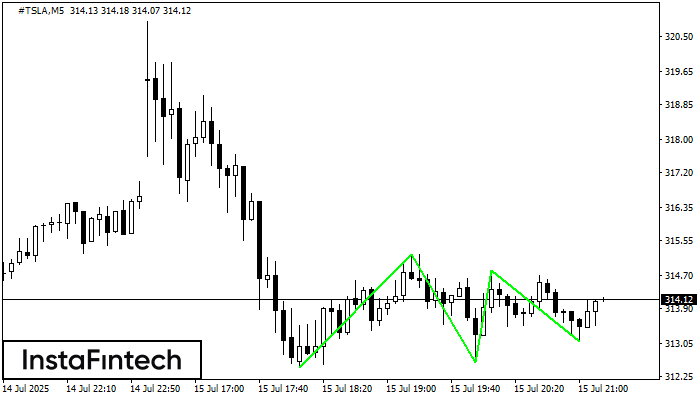
O padrão Fundo triplo foi formado no gráfico de #TSLA M5. Características do padrão: A linha inferior do padrão tem coordenadas 315.22 com o limite superior 315.22/314.84, a projeção
Os intervalos M5 e M15 podem ter mais pontos de entrada falsos.
Open chart in a new window
O padrão Fundo triplo foi formado em #TSLA M5. Possui as seguintes características: nível de resistência 315.22/314.84; nível de suporte 312.48/313.10; a largura é de 274 pontos. Se houver
Os intervalos M5 e M15 podem ter mais pontos de entrada falsos.
Open chart in a new window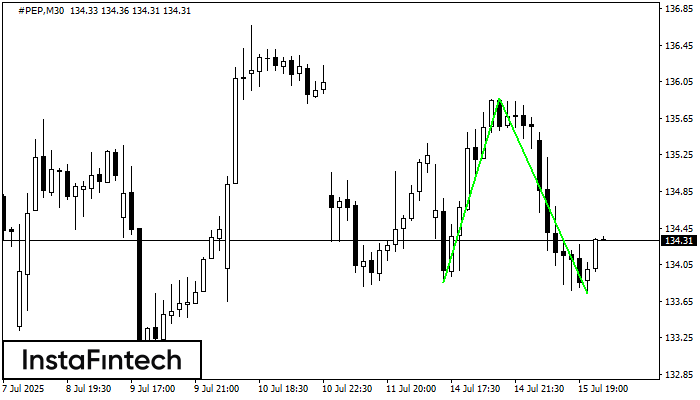
O padrão Fundo duplo foi formado em #PEP M30; o limite superior é 135.87; o limite inferior é 133.74. A largura do padrão é de 201 pontos. No caso
Open chart in a new window


