

signal strength 1 of 5
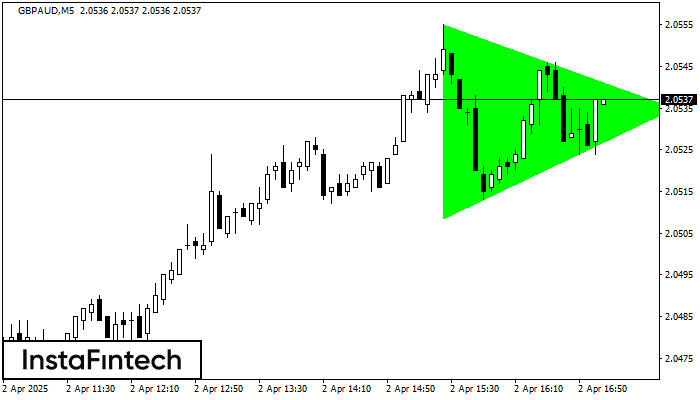
According to the chart of M5, GBPAUD formed the Bullish Symmetrical Triangle pattern. The lower border of the pattern touches the coordinates 2.0508/2.0535 whereas the upper border goes across 2.0555/2.0535. If the Bullish Symmetrical Triangle pattern is in progress, this evidently signals a further upward trend. In other words, in case the scenario comes true, the price of GBPAUD will breach the upper border to head for 2.0550.
The M5 and M15 time frames may have more false entry points.
Veja também
- All
- Double Top
- Flag
- Head and Shoulders
- Pennant
- Rectangle
- Triangle
- Triple top
- All
- #AAPL
- #AMZN
- #Bitcoin
- #EBAY
- #FB
- #GOOG
- #INTC
- #KO
- #MA
- #MCD
- #MSFT
- #NTDOY
- #PEP
- #TSLA
- #TWTR
- AUDCAD
- AUDCHF
- AUDJPY
- AUDUSD
- EURCAD
- EURCHF
- EURGBP
- EURJPY
- EURNZD
- EURRUB
- EURUSD
- GBPAUD
- GBPCHF
- GBPJPY
- GBPUSD
- GOLD
- NZDCAD
- NZDCHF
- NZDJPY
- NZDUSD
- SILVER
- USDCAD
- USDCHF
- USDJPY
- USDRUB
- All
- M5
- M15
- M30
- H1
- D1
- All
- Buy
- Sale
- All
- 1
- 2
- 3
- 4
- 5
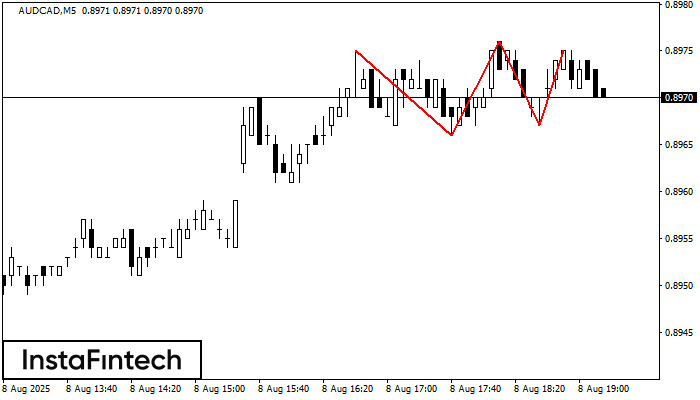
No gráfico do instrumento de negociação AUDCAD M5, o padrão Topo triplo que sinaliza uma mudança de tendência se formou. É possível que após a formação do terceiro pico
Os intervalos M5 e M15 podem ter mais pontos de entrada falsos.
Open chart in a new window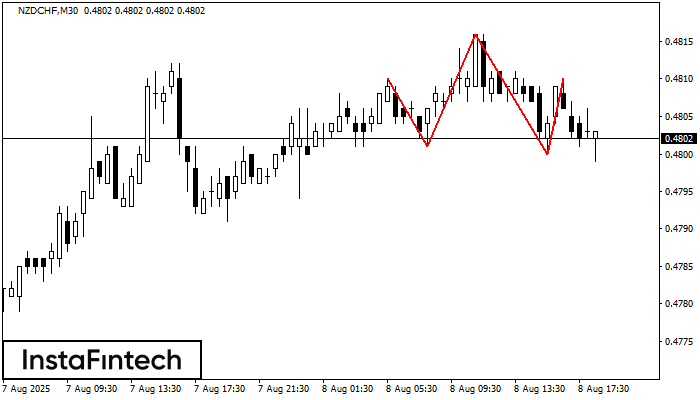
Os NZDCHF M30 formaram o padrão Cabeça & Ombros com as seguintes características: O topo da cabeça está em 0.4816, a linha do pescoço e o ângulo para cima estão
Open chart in a new window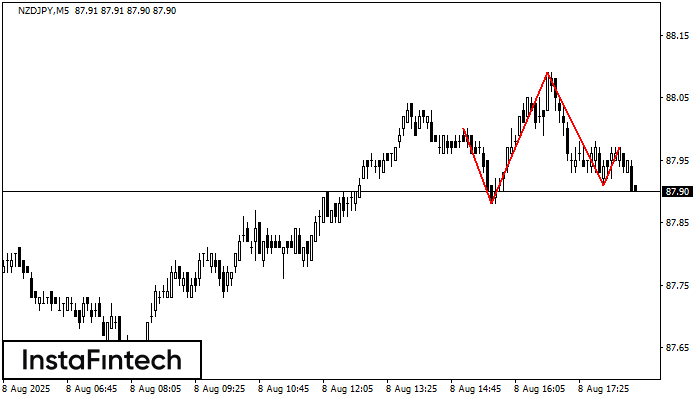
Os NZDJPY M5 formaram o padrão Cabeça & Ombros com as seguintes características: O topo da cabeça está em 88.09, a linha do pescoço e o ângulo para cima estão
Os intervalos M5 e M15 podem ter mais pontos de entrada falsos.
Open chart in a new window


