


signal strength 1 of 5
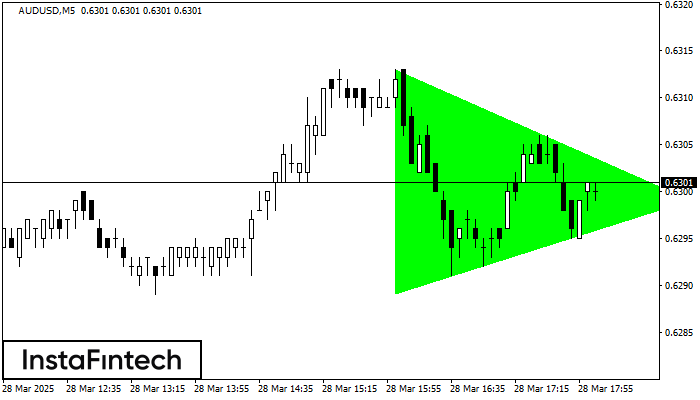
According to the chart of M5, AUDUSD formed the Bullish Symmetrical Triangle pattern, which signals the trend will continue. Description. The upper border of the pattern touches the coordinates 0.6313/0.6299 whereas the lower border goes across 0.6289/0.6299. The pattern width is measured on the chart at 24 pips. If the Bullish Symmetrical Triangle pattern is in progress during the upward trend, this indicates the current trend will go on. In case 0.6299 is broken, the price could continue its move toward 0.6314.
The M5 and M15 time frames may have more false entry points.
Veja também
- All
- Double Top
- Flag
- Head and Shoulders
- Pennant
- Rectangle
- Triangle
- Triple top
- All
- #AAPL
- #AMZN
- #Bitcoin
- #EBAY
- #FB
- #GOOG
- #INTC
- #KO
- #MA
- #MCD
- #MSFT
- #NTDOY
- #PEP
- #TSLA
- #TWTR
- AUDCAD
- AUDCHF
- AUDJPY
- AUDUSD
- EURCAD
- EURCHF
- EURGBP
- EURJPY
- EURNZD
- EURRUB
- EURUSD
- GBPAUD
- GBPCHF
- GBPJPY
- GBPUSD
- GOLD
- NZDCAD
- NZDCHF
- NZDJPY
- NZDUSD
- SILVER
- USDCAD
- USDCHF
- USDJPY
- USDRUB
- All
- M5
- M15
- M30
- H1
- D1
- All
- Buy
- Sale
- All
- 1
- 2
- 3
- 4
- 5

O padrão Topo triplo se formou no gráfico de EURJPY H1. Características do padrão: os limites têm um ângulo ascendente; a linha inferior do padrão tem as coordenadas 161.49/162.07
Open chart in a new window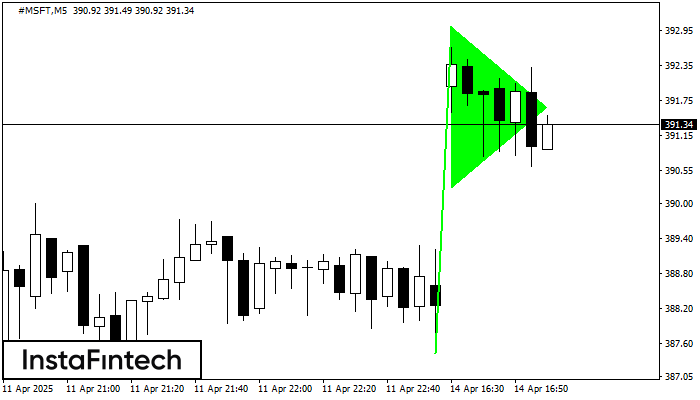
O padrão Pennant de alta é formado no gráfico #MSFT M5. Ele é um tipo do padrão de continuação. Supostamente, se o preço for fixado acima da alta de 393.01
Os intervalos M5 e M15 podem ter mais pontos de entrada falsos.
Open chart in a new window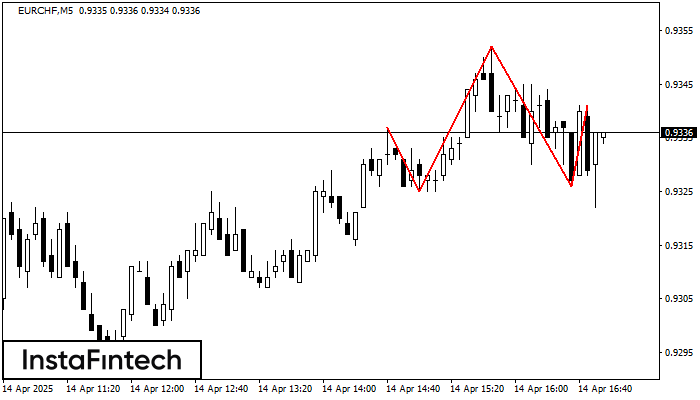
O padrão técnico chamado Cabeça & Ombros apareceu no gráfico de EURCHF M5. Há razões de peso para sugerir que o preço ultrapassará a Linha do Pescoço 0.9325/0.9326 após
Os intervalos M5 e M15 podem ter mais pontos de entrada falsos.
Open chart in a new window


