

signal strength 1 of 5

The Bearish Flag pattern has been formed on the chart #INTC M5. Therefore, the downwards trend is likely to continue in the nearest term. As soon as the price breaks below the low at 24.13, traders should enter the market.
The M5 and M15 time frames may have more false entry points.
Veja também
- All
- Double Top
- Flag
- Head and Shoulders
- Pennant
- Rectangle
- Triangle
- Triple top
- All
- #AAPL
- #AMZN
- #Bitcoin
- #EBAY
- #FB
- #GOOG
- #INTC
- #KO
- #MA
- #MCD
- #MSFT
- #NTDOY
- #PEP
- #TSLA
- #TWTR
- AUDCAD
- AUDCHF
- AUDJPY
- AUDUSD
- EURCAD
- EURCHF
- EURGBP
- EURJPY
- EURNZD
- EURRUB
- EURUSD
- GBPAUD
- GBPCHF
- GBPJPY
- GBPUSD
- GOLD
- NZDCAD
- NZDCHF
- NZDJPY
- NZDUSD
- SILVER
- USDCAD
- USDCHF
- USDJPY
- USDRUB
- All
- M5
- M15
- M30
- H1
- D1
- All
- Buy
- Sale
- All
- 1
- 2
- 3
- 4
- 5
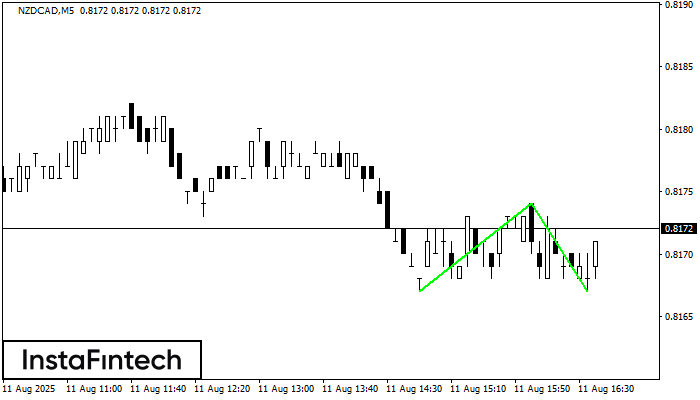
The Double Bottom pattern has been formed on NZDCAD M5. Characteristics: the support level 0.8167; the resistance level 0.8174; the width of the pattern 7 points. If the resistance level
The M5 and M15 time frames may have more false entry points.
Открыть график инструмента в новом окне
The Bearish Flag pattern has been formed on NZDUSD at M5. The lower boundary of the pattern is located at 0.5922/0.5928 while the upper boundary lies at 0.5926/0.5932. The projection
The M5 and M15 time frames may have more false entry points.
Открыть график инструмента в новом окне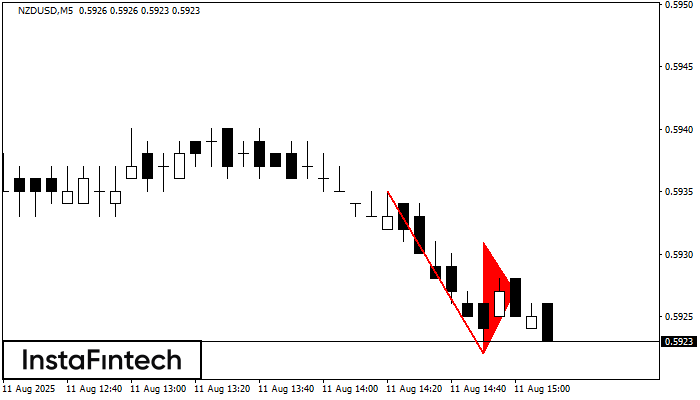
The Bearish pennant pattern has formed on the NZDUSD M5 chart. It signals potential continuation of the existing trend. Specifications: the pattern’s bottom has the coordinate of 0.5922; the projection
The M5 and M15 time frames may have more false entry points.
Открыть график инструмента в новом окне


