empty
11.11.2021 11:25 AM
Bitcoin hit its all-time high and sharply fell amid rumors of Evergrande's bankruptcy. What will happen to Bitcoin in the near future?

Last Friday, Bitcoin has updated the historical high twice but has not managed to break through the resistance at $70,800. Moreover, the cryptocurrency allowed a sharp surge in the growth of volatility following the results of yesterday. This is due to big speculative news that allowed the asset to set a new ATH and fall to a local low after a few hours. As a result, a situation was formed, in which Bitcoin's immediate plans were knocked down by a wave of impulse sales and purchases.

Due to the results of the Fed meeting, where they announced record inflation growth rates for 30 years, the price soared to $69,000. But despite this, the asset failed to break through the $70,000 mark, which also caused a local price reversal. However, the main catalyst for the fall in the BTC price was the excitement in related markets caused by the latest rumors about the bankruptcy of the Chinese developer Evergrande. Yesterday, the company had to pay more than $145 million in interest on securities but did not do it on time, which meant the actual onset of bankruptcy. The market began an immediate reaction to the unverified news, which triggered a correction. Given the fact that the last HANDICAP was established in correlation with the indices of the US financial markets, the price decline and excitement spread to the neighboring market.

However, the news turned out to be fake. The developer made the payment, as reported by representatives of creditors. Despite this, Bitcoin quotes collapsed by 9%, namely from $69k to $62k, which led to the mass liquidation of positions. The total amount of liquidated positions was $700 million, and the largest order was opened in the amount of $65 million paired with ADA. Bitcoin's decline caused a chain reaction, and the entire cryptocurrency market was in the red zone. The total capitalization of all assets fell to $2.86 trillion, and the bitcoin price recovered to $65,200. The price made a rebound from the local support zone at $62,700, after which it hesitantly recovered to the current values.

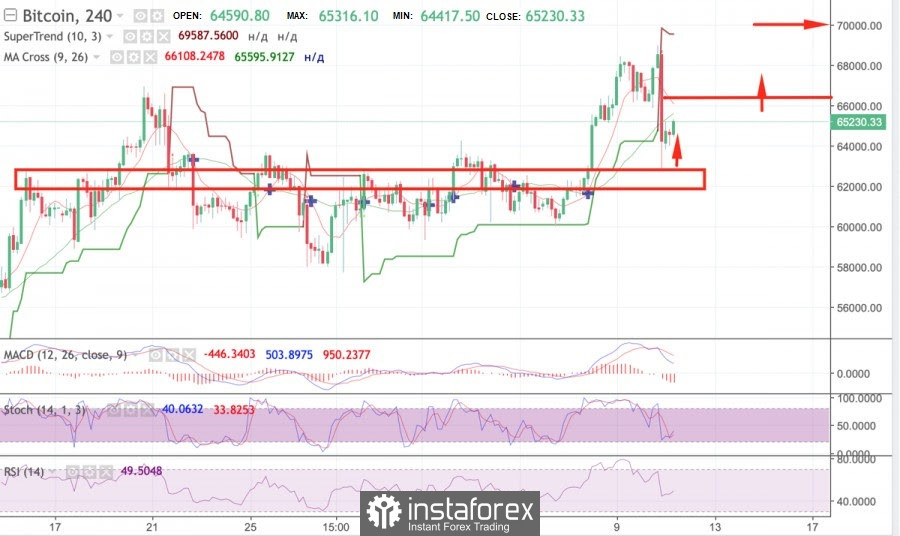
On the four-hour chart, BTC plunged beyond the super trend line, but it is not worth taking this as a change in the medium-term direction of price movement, since the collapse was the result of the impulsive behavior of the players. Now, overcoming the psychological level of $70,00 is postponed due to the need for a local recovery period, which may take some time. In addition to the ATH levels, the price will meet resistance at $66,400 and $68,00. An uncertain red "doji" candle formed on the chart, which meant the interception of the initiative by the bulls, which was reflected in the technical indicators. The stochastic oscillator began an upward movement after the formation of a bullish intersection, and the relative strength index is moving towards the 60 mark within the bullish zone, which indicates an increase in buyer interest. At the same time, there is a downward signal expressed in the divergence between the price movement and the MACD oscillator. Given this, a local pullback at $66,400 can be assumed.
This image is no longer relevant

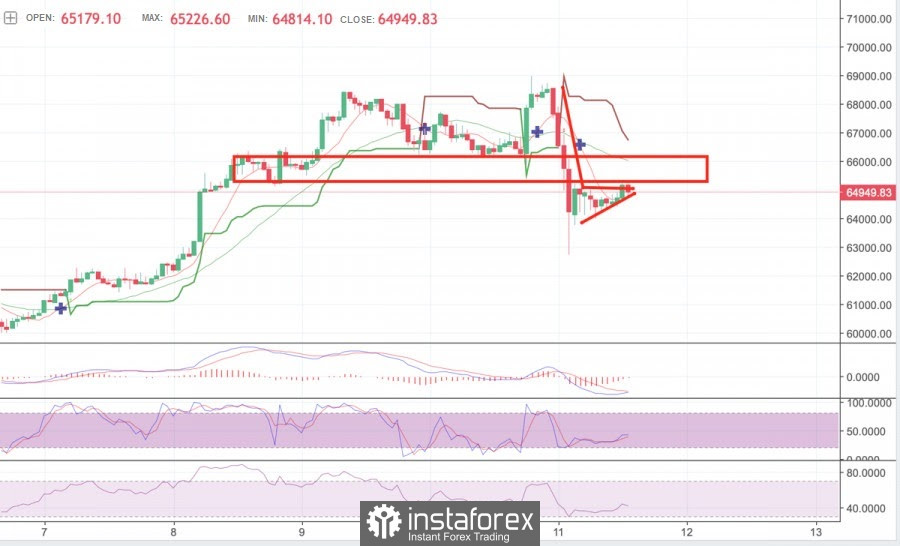
As for the hourly chart, Bitcoin has exhausted the local bullish momentum, which is expressed in the formation of a red candle after a series of uncertain green ones. This is also due to the approach to the local resistance level at $65,247. In addition, a technical analysis figure has formed on the charts. There will be a bullish pennant with an upward compression, at the breakdown of which the price can receive an additional upward impulse. The bullish breakdown of this local pattern is important for further recovery, as technical indicators indicate the weakness of buyers: MACD and stochastic are moving flat and can make a reversal in any direction, and the relative strength index is declining to around 40. The breakdown of the pennant will set the dynamics of the price movement for the next few hours, and the approximate recovery rates will be clear from it, other things being equal in the market.
This image is no longer relevant

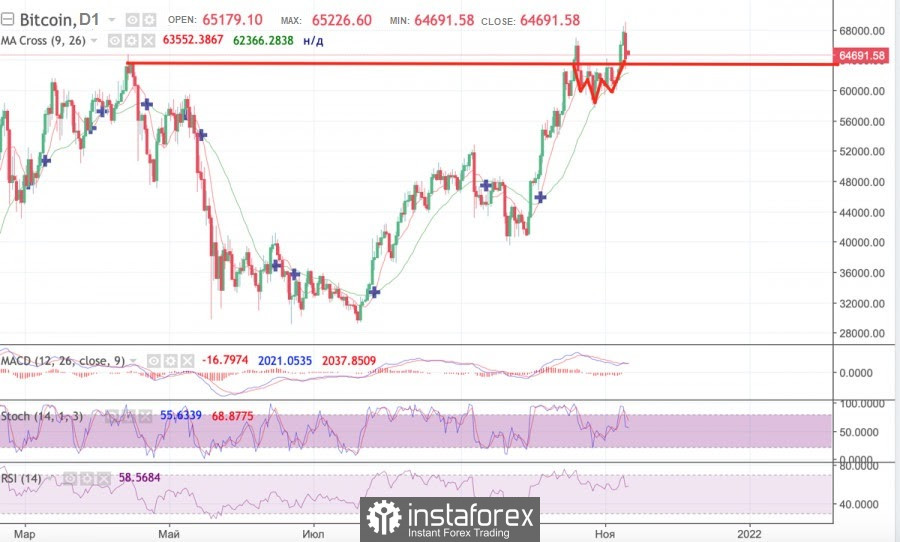
The "head and shoulders" technical analysis figure was formed on the daily chart, indicating a trend reversal, which is a bearish signal to retest key support levels. This is indicated by technical indicators: the MACD began to decline after the formation of a local bearish intersection, but the stochastic and the relative strength index begin to align and move flat. Despite this, the formation of a full-fledged bearish pattern indicates a further decline in the price. The nearest support zones are located at the levels of $64,400, $58,000, and $53,600.

This image is no longer relevant

Artem Petrenko,
Especialista em análise na InstaForex
© 2007-2025
Summary
Urgency
Analytic
Artem Petrenko
Start trade
Ganhe com as variações das taxas das criptomoedas com a InstaForex.
Baixe o MetaTrader 4 e abra a sua primeira operação.
  • Grand Choice
    Contest by
    InstaForex
    InstaForex always strives to help you
    fulfill your biggest dreams.
    PARTICIPE DO CONCURSO

Recommended Stories

Recomendações de negociação para o mercado de criptomoeda em 31 de julho

Após uma sólida retração para cerca de US$ 116.000 ontem, o Bitcoin está novamente sendo negociado a US$ 118.200 hoje, sinalizando uma demanda contínua. O Ethereum também recuperou todas

Miroslaw Bawulski 17:17 2025-07-31 UTC+2

Primeiro relatório sobre políticas de criptomoedas dos EUA abre uma nova era

O Bitcoin registrou uma breve queda após a recente decisão do Fed, mas rapidamente se recuperou, mantendo sua negociação dentro da faixa entre US$ 116.000 e US$ 120.000. Esse movimento

Jakub Novak 15:20 2025-07-31 UTC+2

Dicas de negociação para o mercado de criptomoedas em 30 de julho (sessão norte-americana)

O Bitcoin permanece firme acima de US$ 118.000, visando claramente uma possível alta acima de US$ 120.000. O Ethereum sofreu uma ligeira correção, mas continua sendo negociado dentro

Miroslaw Bawulski 18:30 2025-07-30 UTC+2

Recomendações de negociação para o mercado de criptomoedas em 30 de julho

O Bitcoin continua a ser negociado dentro de um canal lateral estreito, e uma ruptura determinará sua próxima direção. O Ethereum está apresentando o mesmo padrão. Entretanto, enquanto você considera

Miroslaw Bawulski 17:02 2025-07-30 UTC+2

É hora de considerar a compra de XRP?

Bitcoin e Ethereum continuam sendo negociados em níveis semelhantes, sem mudanças significativas na dinâmica do mercado. Se os preços atuais fazem esses ativos parecerem caros demais, talvez valha a pena

Jakub Novak 16:44 2025-07-30 UTC+2

A reunião do Fed hoje pode impulsionar o mercado de criptomoedas

A reunião de política monetária da Reserva Federal dos Estados Unidos hoje pode impulsionar o mercado de criptomoedas. Mesmo a menor sugestão do comitê sobre um possível corte nas taxas

Jakub Novak 14:02 2025-07-30 UTC+2

Recomendações de negociação para o mercado de criptomoedas em 29 de julho

O Bitcoin foi corrigido no final do dia de ontem, testando o nível de US$ 117.500, mas já está sendo negociado acima de US$ 119.000 hoje, indicando uma alta demanda

Miroslaw Bawulski 17:35 2025-07-29 UTC+2

Mercado de criptomoedas: compradores ditam o ritmo em meio a acordos comerciais e expectativa pela decisão do Fed

O índice de Medo & Ganância do mercado de criptomoedas está atualmente em 73 de 100, indicando uma zona de ganância e forte interesse de compra entre os participantes. Enquanto

Jurij Tolin 15:56 2025-07-29 UTC+2

A demanda por Bitcoin e Ethereum continua forte

À medida que o mercado de criptomoedas passa por correções, sempre há quem aproveite o momento para adquirir ativos com desconto de forma estratégica. Segundo centros de análise especializados, diversas

Jakub Novak 15:02 2025-07-29 UTC+2

Dicas de negociação para o mercado de criptomoedas em 28 de julho (sessão norte-americana)

Bitcoin voltou a tentar testar a marca de US$ 120.000, mas não conseguiu se consolidar acima desse patamar, recuando atualmente para abaixo de US$ 119.000, com cotação na casa

Miroslaw Bawulski 17:39 2025-07-28 UTC+2
Não pode falar agora?
Faça sua pergunta no chat.
Widget callback
 

Dear visitor,

Your IP address shows that you are currently located in the USA. If you are a resident of the United States, you are prohibited from using the services of InstaFintech Group including online trading, online transfers, deposit/withdrawal of funds, etc.

If you think you are seeing this message by mistake and your location is not the US, kindly proceed to the website. Otherwise, you must leave the website in order to comply with government restrictions.

Why does your IP address show your location as the USA?

  • - you are using a VPN provided by a hosting company based in the United States;
  • - your IP does not have proper WHOIS records;
  • - an error occurred in the WHOIS geolocation database.

Please confirm whether you are a US resident or not by clicking the relevant button below. If you choose the wrong option, being a US resident, you will not be able to open an account with InstaForex anyway.

We are sorry for any inconvenience caused by this message.