


signal strength 1 of 5

The Bearish Flag pattern has been formed on the chart AUDCAD M5 which signals that the downward trend will continue. If the price breaks below the low at 0.8881, then it is most likely to move further downwards. The price will likely move by the number of points which equals the length of the flag pole (10 points).
The M5 and M15 time frames may have more false entry points.
See Also
- All
- Double Top
- Flag
- Head and Shoulders
- Pennant
- Rectangle
- Triangle
- Triple top
- All
- #AAPL
- #AMZN
- #Bitcoin
- #EBAY
- #FB
- #GOOG
- #INTC
- #KO
- #MA
- #MCD
- #MSFT
- #NTDOY
- #PEP
- #TSLA
- #TWTR
- AUDCAD
- AUDCHF
- AUDJPY
- AUDUSD
- EURCAD
- EURCHF
- EURGBP
- EURJPY
- EURNZD
- EURRUB
- EURUSD
- GBPAUD
- GBPCHF
- GBPJPY
- GBPUSD
- GOLD
- NZDCAD
- NZDCHF
- NZDJPY
- NZDUSD
- SILVER
- USDCAD
- USDCHF
- USDJPY
- USDRUB
- All
- M5
- M15
- M30
- H1
- D1
- All
- Buy
- Sale
- All
- 1
- 2
- 3
- 4
- 5
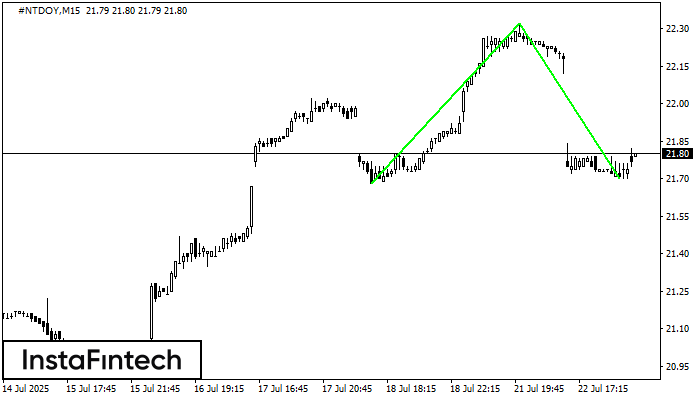
The Double Bottom pattern has been formed on #NTDOY M15; the upper boundary is 22.32; the lower boundary is 21.70. The width of the pattern is 64 points. In case
The M5 and M15 time frames may have more false entry points.
Open chart in a new window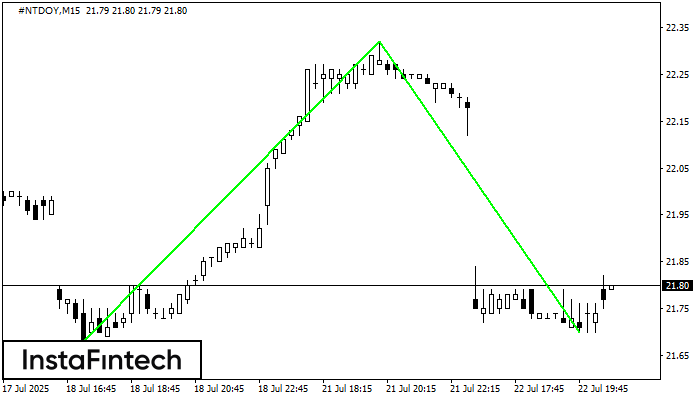
The Double Bottom pattern has been formed on #NTDOY M15. Characteristics: the support level 21.68; the resistance level 22.32; the width of the pattern 64 points. If the resistance level
The M5 and M15 time frames may have more false entry points.
Open chart in a new window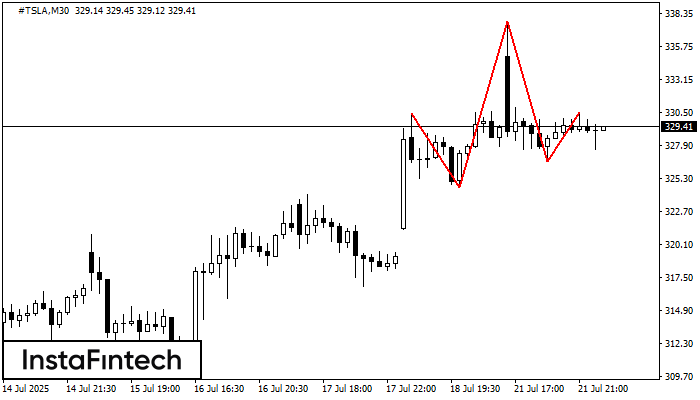
The #TSLA M30 formed the Head and Shoulders pattern with the following features: The Head’s top is at 337.71, the Neckline and the upward angle are at 324.60/326.66. The formation
Open chart in a new window


