


signal strength 1 of 5
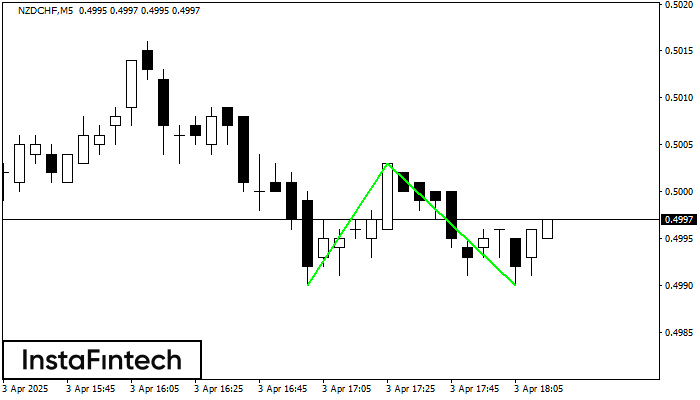
The Double Bottom pattern has been formed on NZDCHF M5. This formation signals a reversal of the trend from downwards to upwards. The signal is that a buy trade should be opened after the upper boundary of the pattern 0.5003 is broken. The further movements will rely on the width of the current pattern 13 points.
The M5 and M15 time frames may have more false entry points.
See Also
- All
- Double Top
- Flag
- Head and Shoulders
- Pennant
- Rectangle
- Triangle
- Triple top
- All
- #AAPL
- #AMZN
- #Bitcoin
- #EBAY
- #FB
- #GOOG
- #INTC
- #KO
- #MA
- #MCD
- #MSFT
- #NTDOY
- #PEP
- #TSLA
- #TWTR
- AUDCAD
- AUDCHF
- AUDJPY
- AUDUSD
- EURCAD
- EURCHF
- EURGBP
- EURJPY
- EURNZD
- EURRUB
- EURUSD
- GBPAUD
- GBPCHF
- GBPJPY
- GBPUSD
- GOLD
- NZDCAD
- NZDCHF
- NZDJPY
- NZDUSD
- SILVER
- USDCAD
- USDCHF
- USDJPY
- USDRUB
- All
- M5
- M15
- M30
- H1
- D1
- All
- Buy
- Sale
- All
- 1
- 2
- 3
- 4
- 5
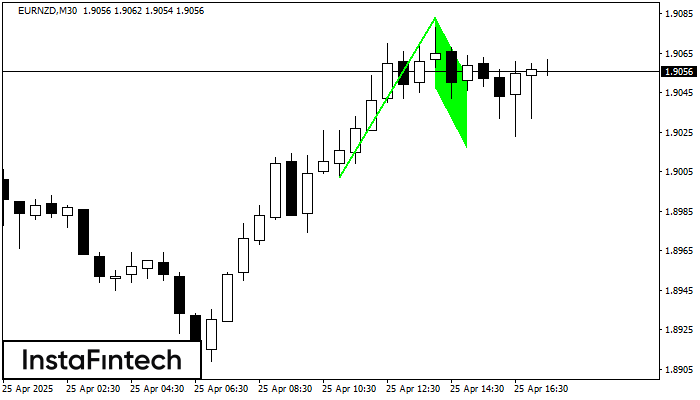
Corak Flag Aliran Menaik telah dibentuk pada carta EURNZD M30 yang memberi isyarat bahawa aliran menaik akan berterusan. Isyarat: penembusan bahagian atas pada 1.9083 boleh menolak harga yang lebih tinggi
Open chart in a new window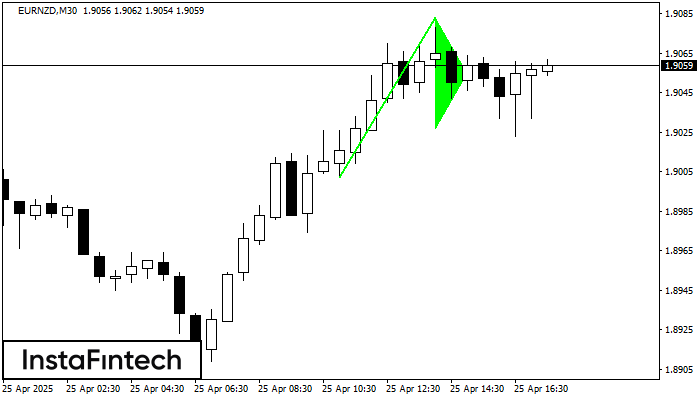
Corak grafik Pennant Aliran Menaik telah terbentuk pada instrumen EURNZD M30. Jenis corak ini berada di bawah kategori corak kesinambungan. Dalam situasi ini, sekiranya penetapan harga boleh menembusi tinggi, adalah
Open chart in a new window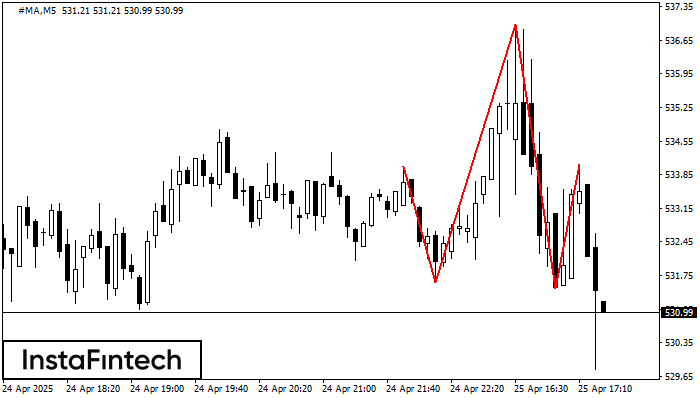
Corak teknikal yang dipanggil Head dan Shoulders telah muncul pada carta #MA M5. Terdapat alasan yang berat untuk menunjukkan bahawa harga akan mengatasi garisan Neck 531.61/531.48 selepas Shoulder kanan telah
Carta masa M5 dan M15 mungkin mempunyai lebih banyak titik kemasukan palsu.
Open chart in a new window


