

signal strength 1 of 5
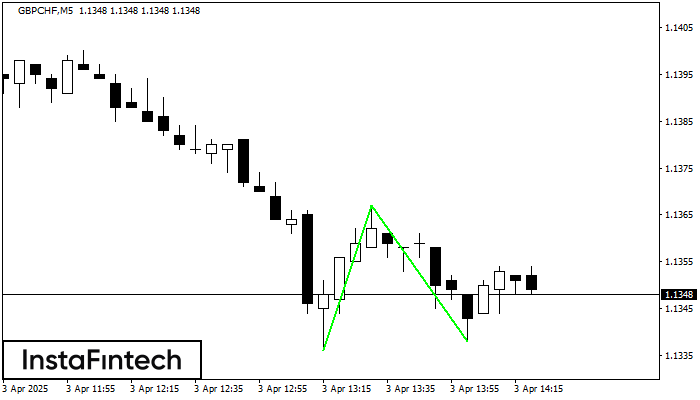
The Double Bottom pattern has been formed on GBPCHF M5. Characteristics: the support level 1.1336; the resistance level 1.1367; the width of the pattern 31 points. If the resistance level is broken, a change in the trend can be predicted with the first target point lying at the distance of 29 points.
The M5 and M15 time frames may have more false entry points.
See Also
- All
- Double Top
- Flag
- Head and Shoulders
- Pennant
- Rectangle
- Triangle
- Triple top
- All
- #AAPL
- #AMZN
- #Bitcoin
- #EBAY
- #FB
- #GOOG
- #INTC
- #KO
- #MA
- #MCD
- #MSFT
- #NTDOY
- #PEP
- #TSLA
- #TWTR
- AUDCAD
- AUDCHF
- AUDJPY
- AUDUSD
- EURCAD
- EURCHF
- EURGBP
- EURJPY
- EURNZD
- EURRUB
- EURUSD
- GBPAUD
- GBPCHF
- GBPJPY
- GBPUSD
- GOLD
- NZDCAD
- NZDCHF
- NZDJPY
- NZDUSD
- SILVER
- USDCAD
- USDCHF
- USDJPY
- USDRUB
- All
- M5
- M15
- M30
- H1
- D1
- All
- Buy
- Sale
- All
- 1
- 2
- 3
- 4
- 5
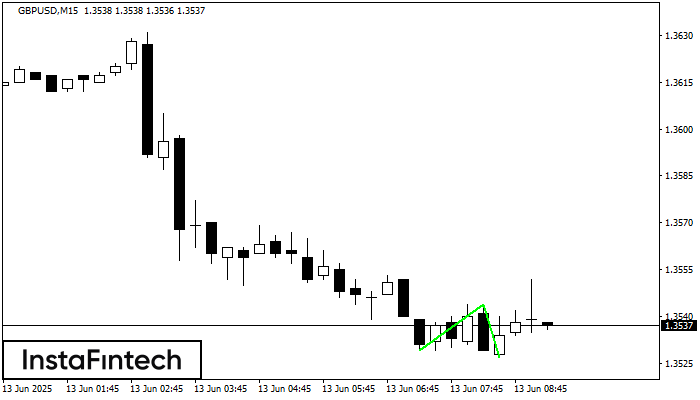
The Double Bottom pattern has been formed on GBPUSD M15. Characteristics: the support level 1.3529; the resistance level 1.3544; the width of the pattern 15 points. If the resistance level
The M5 and M15 time frames may have more false entry points.
Открыть график инструмента в новом окне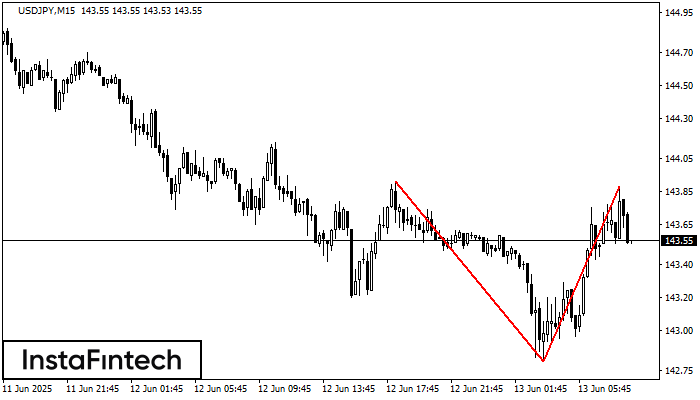
On the chart of USDJPY M15 the Double Top reversal pattern has been formed. Characteristics: the upper boundary 143.88; the lower boundary 142.81; the width of the pattern 107 points
The M5 and M15 time frames may have more false entry points.
Открыть график инструмента в новом окне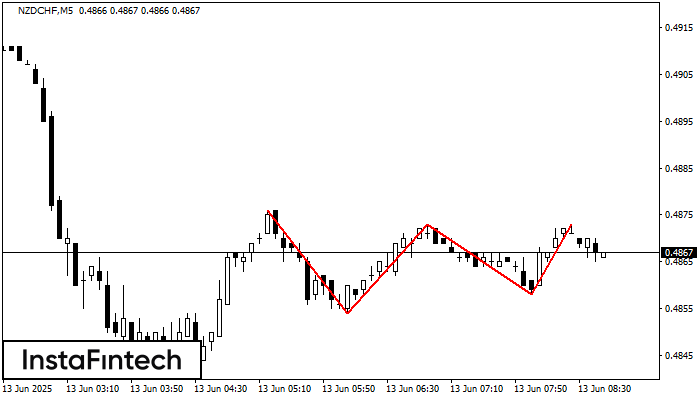
On the chart of the NZDCHF M5 trading instrument, the Triple Top pattern that signals a trend change has formed. It is possible that after formation of the third peak
The M5 and M15 time frames may have more false entry points.
Открыть график инструмента в новом окне


