


signal strength 1 of 5
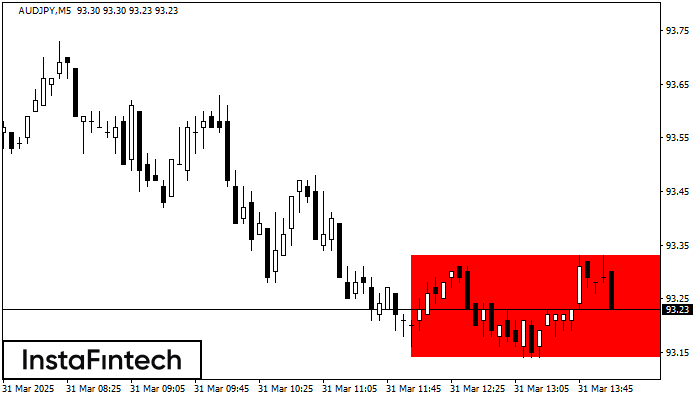
According to the chart of M5, AUDJPY formed the Bearish Rectangle. This type of a pattern indicates a trend continuation. It consists of two levels: resistance 93.33 - 0.00 and support 93.14 – 93.14. In case the resistance level 93.14 - 93.14 is broken, the instrument is likely to follow the bearish trend.
The M5 and M15 time frames may have more false entry points.
See Also
- All
- Double Top
- Flag
- Head and Shoulders
- Pennant
- Rectangle
- Triangle
- Triple top
- All
- #AAPL
- #AMZN
- #Bitcoin
- #EBAY
- #FB
- #GOOG
- #INTC
- #KO
- #MA
- #MCD
- #MSFT
- #NTDOY
- #PEP
- #TSLA
- #TWTR
- AUDCAD
- AUDCHF
- AUDJPY
- AUDUSD
- EURCAD
- EURCHF
- EURGBP
- EURJPY
- EURNZD
- EURRUB
- EURUSD
- GBPAUD
- GBPCHF
- GBPJPY
- GBPUSD
- GOLD
- NZDCAD
- NZDCHF
- NZDJPY
- NZDUSD
- SILVER
- USDCAD
- USDCHF
- USDJPY
- USDRUB
- All
- M5
- M15
- M30
- H1
- D1
- All
- Buy
- Sale
- All
- 1
- 2
- 3
- 4
- 5
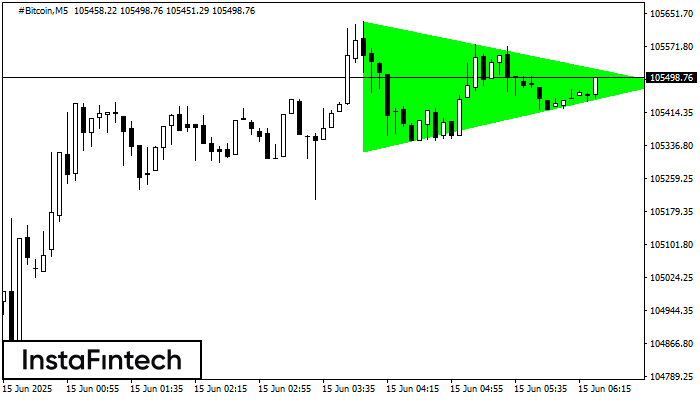
M5 চার্ট অনুযায়ী, #Bitcoin বুলিশ সিমেট্রিকাল ট্রায়াঙ্গেল প্যাটার্ন গঠন করেছে। বর্ণনা: এটি একটি ধারাবাহিক প্রবণতার প্যাটার্ন। 105631.72 এবং 105322.26 হল যথাক্রমে উপরের এবং নীচের সীমানার কোঅর্ডিনেট। চার্টে প্যাটার্নের প্রস্থ 30946
M5 এবং M15 টাইম ফ্রেমে আরও ভুল এন্ট্রি পয়েন্ট থাকতে পারে।
Open chart in a new window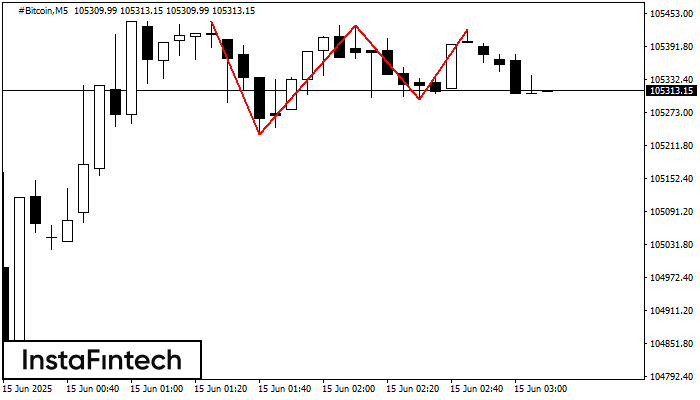
M5 চার্টে, #Bitcoin ট্রেডিং ইন্সট্রুমেন্টের ট্রিপল টপ প্যাটার্ন গঠিত হয়েছে। এটি একটি রিভার্সাল বা বিপরীতমুখী প্যাটার্ন যা নিম্নলিখিত বৈশিষ্ট্যগুলিকে সমন্বিত করে: রেজিস্ট্যান্স স্তর 1384, সাপোর্ট স্তর -6448 এবং প্যাটার্নের প্রস্থ
M5 এবং M15 টাইম ফ্রেমে আরও ভুল এন্ট্রি পয়েন্ট থাকতে পারে।
Open chart in a new window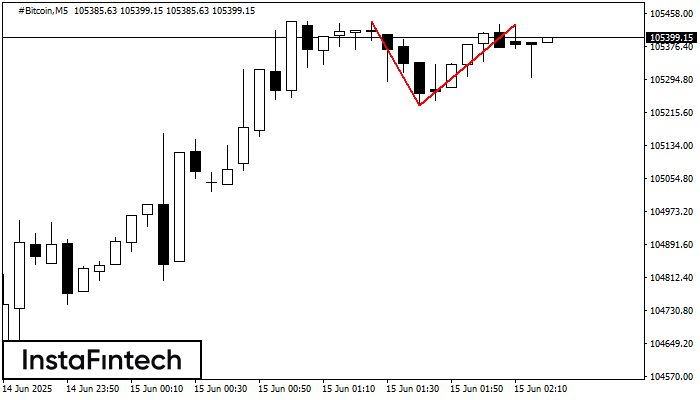
M5 চার্টে, #Bitcoin-এর ডাবল টপ রিভার্সাল বা বিপরীতমুখী প্যাটার্ন গঠিত হয়েছে। বৈশিষ্ট্য: উপরের সীমানা 105430.30; নীচের সীমানা 105231.35; প্যাটার্নের প্রস্থ 19895 পয়েন্ট। সংকেত: নীচের সীমানা ব্রেক করা হলে 105231.20 স্তরের
M5 এবং M15 টাইম ফ্রেমে আরও ভুল এন্ট্রি পয়েন্ট থাকতে পারে।
Open chart in a new window


