


signal strength 1 of 5
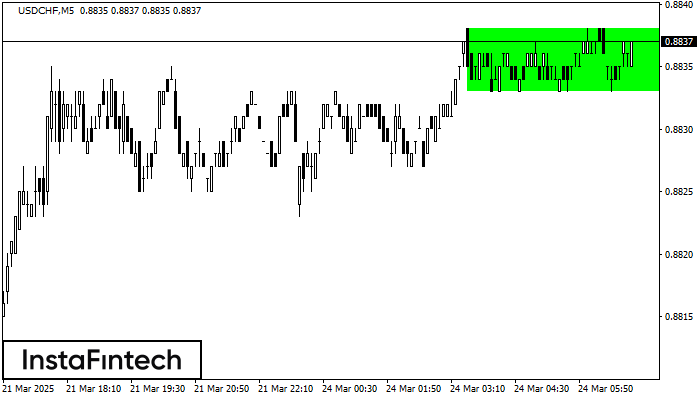
According to the chart of M5, USDCHF formed the Bullish Rectangle. This type of a pattern indicates a trend continuation. It consists of two levels: resistance 0.8838 and support 0.8833. In case the resistance level 0.8838 - 0.8838 is broken, the instrument is likely to follow the bullish trend.
The M5 and M15 time frames may have more false entry points.
- All
- Double Top
- Flag
- Head and Shoulders
- Pennant
- Rectangle
- Triangle
- Triple top
- All
- #AAPL
- #AMZN
- #Bitcoin
- #EBAY
- #FB
- #GOOG
- #INTC
- #KO
- #MA
- #MCD
- #MSFT
- #NTDOY
- #PEP
- #TSLA
- #TWTR
- AUDCAD
- AUDCHF
- AUDJPY
- AUDUSD
- EURCAD
- EURCHF
- EURGBP
- EURJPY
- EURNZD
- EURRUB
- EURUSD
- GBPAUD
- GBPCHF
- GBPJPY
- GBPUSD
- GOLD
- NZDCAD
- NZDCHF
- NZDJPY
- NZDUSD
- SILVER
- USDCAD
- USDCHF
- USDJPY
- USDRUB
- All
- M5
- M15
- M30
- H1
- D1
- All
- Buy
- Sale
- All
- 1
- 2
- 3
- 4
- 5
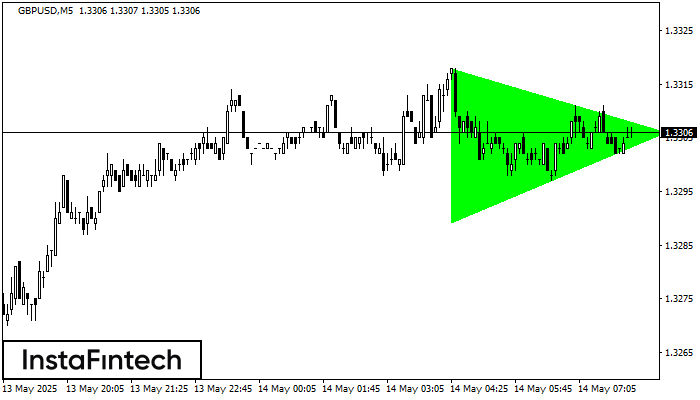
По GBPUSD на M5 сформировалась фигура «Бычий симметричный треугольник». Нижняя граница фигуры имеет координаты 1.3289/1.3306, при этом верхняя граница 1.3318/1.3306. Формирование фигуры «Бычий симметричный треугольник» наиболее вероятным образом свидетельствует
Таймфреймы М5 и М15 могут иметь больше ложных точек входа.
Открыть график инструмента в новом окне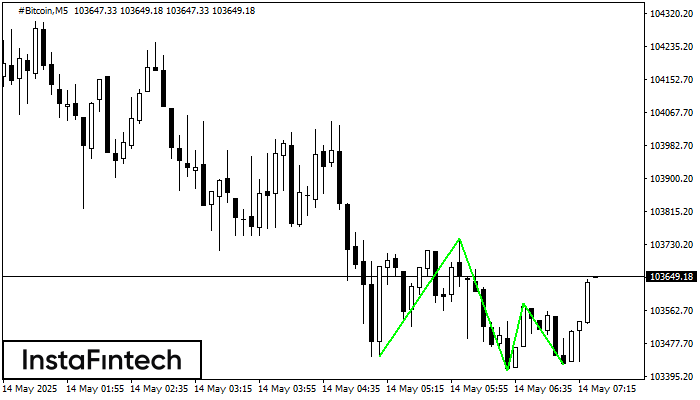
По #Bitcoin на M5 сформировалась фигура «Тройное дно». Характеристика: Нижняя граница фигуры имеет координаты 103423.95, при этом верхняя граница 103747.47/103579.90. Проекция ширины 33742 пунктов. Формирование фигуры «Тройное дно» наиболее вероятным
Таймфреймы М5 и М15 могут иметь больше ложных точек входа.
Открыть график инструмента в новом окне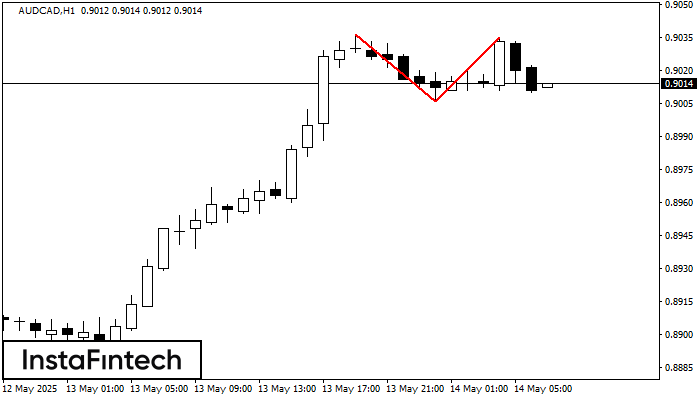
На торговом графике AUDCAD H1 сформировалась разворотная фигура «Двойная вершина». Характеристика: Верхняя граница 0.9035; Нижняя граница 0.9006; Ширина фигуры 29 пунктов. Сигнал: Пробой нижней границы 0.9006 приведет к дальнейшему нисходящему
Открыть график инструмента в новом окне


