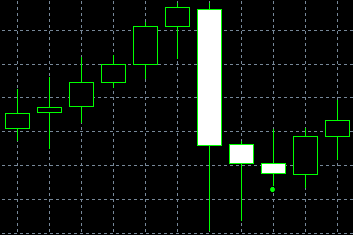
The Three Stars in the South is a bullish reversal pattern which indicates a gradual weakening of a bearish trend as the intraday price dynamics gets less robust while daily lows move higher. The key point of formation of this pattern is a long lower shadow on the first day as this is an obvious sign of increased buying interest.
On the next day prices always open higher. After that they decrease but remain above the level fixed on the previous day. The closing price on the second day is also higher than the daily low. On the third day a black marubozu appears which is engulfed in the trading range of the previous day.
How to recognize the pattern?
1. On the first day a long black body with a long lower shadow appears. It looks like the Hammer pattern.
2. The same figure is seen on the second day, but it is smaller. The low of the second day is above the low of the previous day.
3. On the third day a little black marubozu is formed. It opens and closes within the trading range of the previous day.
Scenario and behavior
When the price forms a new low and rebounds from it to close a trading day above the daily low, it indicates that a bearish trend is developing. Market participants who have short trades get worried about this situation as it reflects the buying momentum which has not been revealed until that.
The price will open higher on the next trading day, so some bulls will be able to close their long positions. Moreover, the price closes at a daily high. Trades are executed at lower levels but remain above the levels of the previous day, so the session ends above its low.
After that bears express concerns over the higher low. Traders are hesitant on the last day with prices barely moving. Nobody who has short trades wants to see further rise in prices.
Flexibility
The last trading day of this model may have small shadows, but it would not make much difference. The key feature of this pattern is that every next day is engulfed in the trading range of the previous day.
Development
The Three Stars in the South pattern is represented by a long black candle which is usually of a bearish type. That’s why it is recommended to wait for confirmation of this pattern.
Related patterns
The Three Stars in the South pattern looks like the Three Black Crows pattern, but the last one does not indicate gradual fall in daily lows, and the candle of the last day remains long. Besides, Three Stars in the South is a bullish pattern while Three Black Crows is a bearish one.


