

signal strength 1 of 5

The Bullish Flag pattern has been formed on USDCAD at M5. The lower boundary of the pattern is located at 1.3870/1.3862, while the higher boundary lies at 1.3876/1.3868. The projection of the flagpole is 16 points. This formation signals that the upward trend is most likely to continue. Therefore, if the level of 1.3876 is broken, the price will move further upwards.
The M5 and M15 time frames may have more false entry points.
- All
- Double Top
- Flag
- Head and Shoulders
- Pennant
- Rectangle
- Triangle
- Triple top
- All
- #AAPL
- #AMZN
- #Bitcoin
- #EBAY
- #FB
- #GOOG
- #INTC
- #KO
- #MA
- #MCD
- #MSFT
- #NTDOY
- #PEP
- #TSLA
- #TWTR
- AUDCAD
- AUDCHF
- AUDJPY
- AUDUSD
- EURCAD
- EURCHF
- EURGBP
- EURJPY
- EURNZD
- EURRUB
- EURUSD
- GBPAUD
- GBPCHF
- GBPJPY
- GBPUSD
- GOLD
- NZDCAD
- NZDCHF
- NZDJPY
- NZDUSD
- SILVER
- USDCAD
- USDCHF
- USDJPY
- USDRUB
- All
- M5
- M15
- M30
- H1
- D1
- All
- Buy
- Sale
- All
- 1
- 2
- 3
- 4
- 5
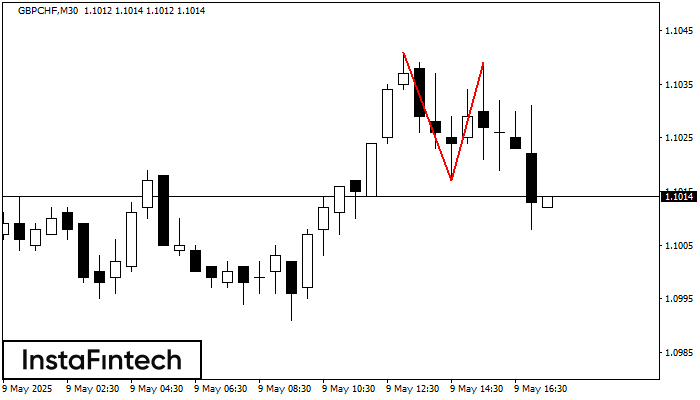
The Double Top reversal pattern has been formed on GBPCHF M30. Characteristics: the upper boundary 1.1041; the lower boundary 1.1017; the width of the pattern is 22 points. Sell trades
Open chart in a new window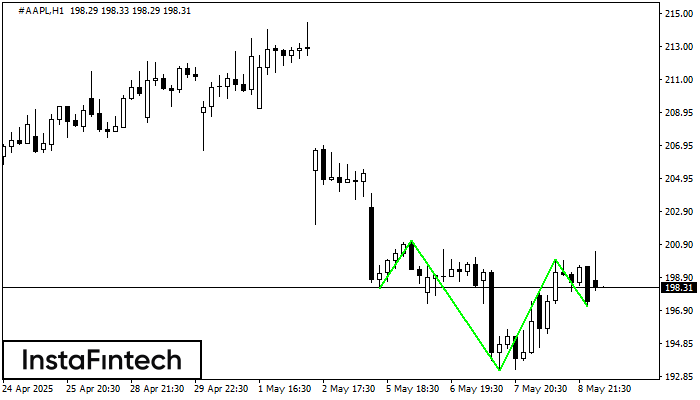
According to the chart of H1, #AAPL formed the Inverse Head and Shoulder pattern. The Head’s top is set at 200.00 while the median line of the Neck is found
Open chart in a new window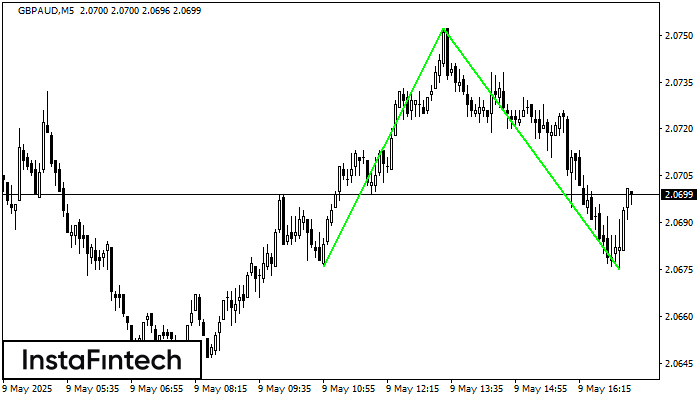
The Double Bottom pattern has been formed on GBPAUD M5. Characteristics: the support level 2.0676; the resistance level 2.0752; the width of the pattern 76 points. If the resistance level
The M5 and M15 time frames may have more false entry points.
Open chart in a new window


