

signal strength 1 of 5
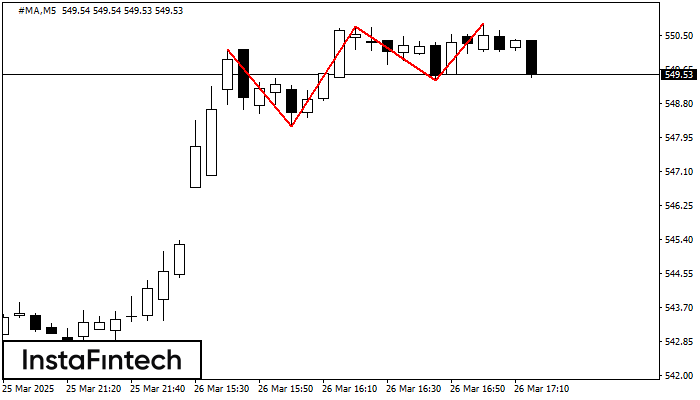
The Triple Top pattern has formed on the chart of the #MA M5 trading instrument. It is a reversal pattern featuring the following characteristics: resistance level -66, support level -113, and pattern’s width 192. Forecast If the price breaks through the support level 548.24, it is likely to move further down to 550.59.
The M5 and M15 time frames may have more false entry points.
یہ بھی دیکھیں
- All
- Double Top
- Flag
- Head and Shoulders
- Pennant
- Rectangle
- Triangle
- Triple top
- All
- #AAPL
- #AMZN
- #Bitcoin
- #EBAY
- #FB
- #GOOG
- #INTC
- #KO
- #MA
- #MCD
- #MSFT
- #NTDOY
- #PEP
- #TSLA
- #TWTR
- AUDCAD
- AUDCHF
- AUDJPY
- AUDUSD
- EURCAD
- EURCHF
- EURGBP
- EURJPY
- EURNZD
- EURRUB
- EURUSD
- GBPAUD
- GBPCHF
- GBPJPY
- GBPUSD
- GOLD
- NZDCAD
- NZDCHF
- NZDJPY
- NZDUSD
- SILVER
- USDCAD
- USDCHF
- USDJPY
- USDRUB
- All
- M5
- M15
- M30
- H1
- D1
- All
- Buy
- Sale
- All
- 1
- 2
- 3
- 4
- 5
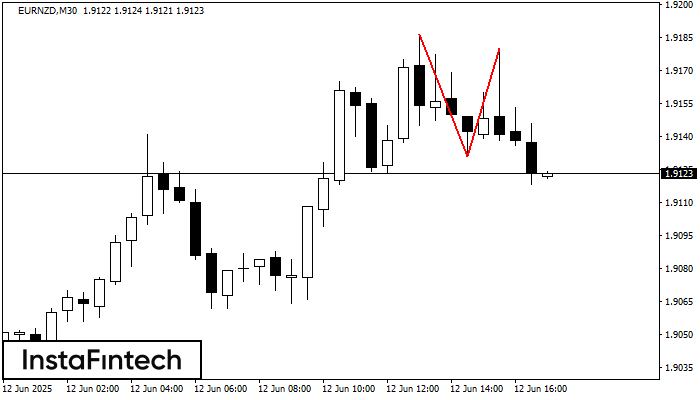
On the chart of EURNZD M30 the Double Top reversal pattern has been formed. Characteristics: the upper boundary 1.9180; the lower boundary 1.9131; the width of the pattern 49 points
Открыть график инструмента в новом окне
According to the chart of M5, #TSLA formed the Bearish Rectangle. The pattern indicates a trend continuation. The upper border is 326.44, the lower border is 322.56. The signal means
The M5 and M15 time frames may have more false entry points.
Открыть график инструмента в новом окне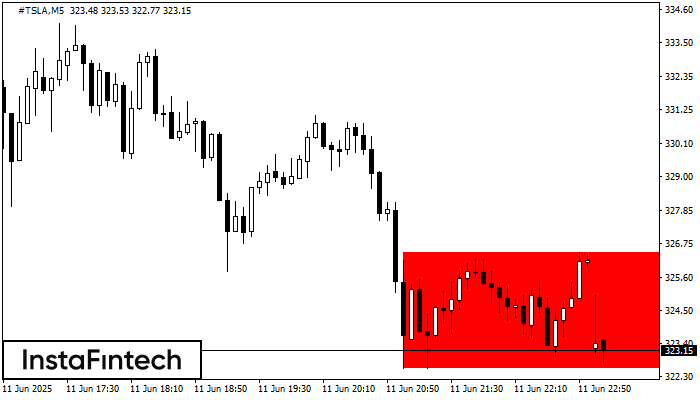
According to the chart of M5, #TSLA formed the Bearish Rectangle which is a pattern of a trend continuation. The pattern is contained within the following borders: lower border 322.56
The M5 and M15 time frames may have more false entry points.
Открыть график инструмента в новом окне


