

signal strength 1 of 5
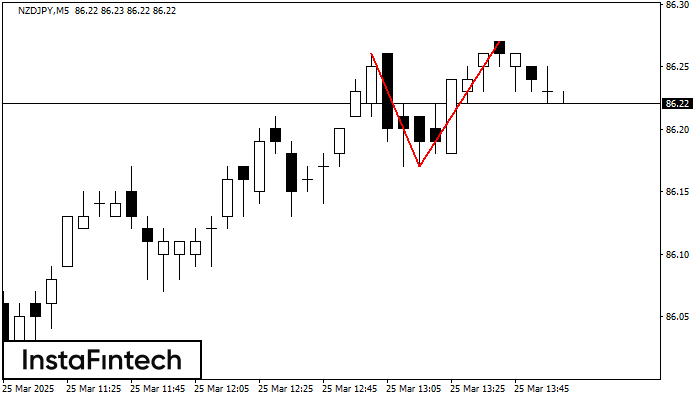
The Double Top reversal pattern has been formed on NZDJPY M5. Characteristics: the upper boundary 86.26; the lower boundary 86.17; the width of the pattern is 10 points. Sell trades are better to be opened below the lower boundary 86.17 with a possible movements towards the 86.02 level.
The M5 and M15 time frames may have more false entry points.
یہ بھی دیکھیں
- All
- Double Top
- Flag
- Head and Shoulders
- Pennant
- Rectangle
- Triangle
- Triple top
- All
- #AAPL
- #AMZN
- #Bitcoin
- #EBAY
- #FB
- #GOOG
- #INTC
- #KO
- #MA
- #MCD
- #MSFT
- #NTDOY
- #PEP
- #TSLA
- #TWTR
- AUDCAD
- AUDCHF
- AUDJPY
- AUDUSD
- EURCAD
- EURCHF
- EURGBP
- EURJPY
- EURNZD
- EURRUB
- EURUSD
- GBPAUD
- GBPCHF
- GBPJPY
- GBPUSD
- GOLD
- NZDCAD
- NZDCHF
- NZDJPY
- NZDUSD
- SILVER
- USDCAD
- USDCHF
- USDJPY
- USDRUB
- All
- M5
- M15
- M30
- H1
- D1
- All
- Buy
- Sale
- All
- 1
- 2
- 3
- 4
- 5
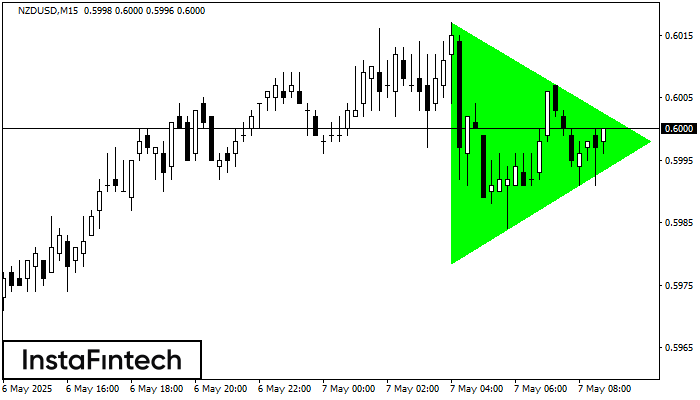
M15 के चार्ट के अनुसार, NZDUSD से बुलिश सिमेट्रिकल त्रिभुज पैटर्न बना। पैटर्न की निचली सीमा ने निर्देशांक 0.5979/0.5998 को स्पर्श किया जबकि ऊपरी सीमा 0.6017/0.5998 के पार गई। यदि
M5 और M15 समय सीमा में अधिक फाल्स एंट्री पॉइंट्स हो सकते हैं।
Open chart in a new window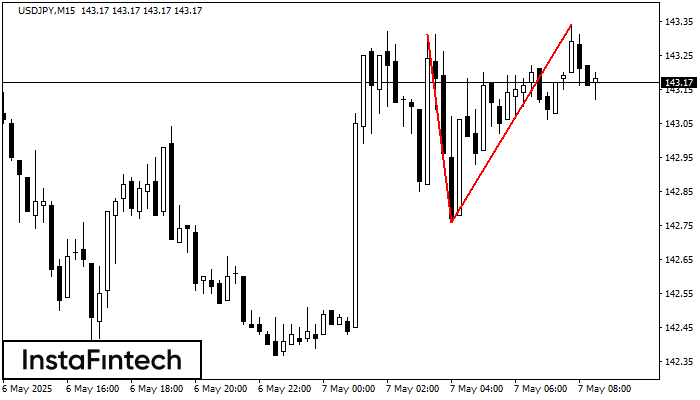
USDJPY M15 पर डबल टॉप रीवर्सल पैटर्न बना है। विशेषताएं: ऊपरी सीमा 143.31; निचली सीमा 142.76; पैटर्न की चौड़ाई 58 पॉइंट्स है। सेल ट्रेडों को 142.76 की निचली सीमा के
M5 और M15 समय सीमा में अधिक फाल्स एंट्री पॉइंट्स हो सकते हैं।
Open chart in a new window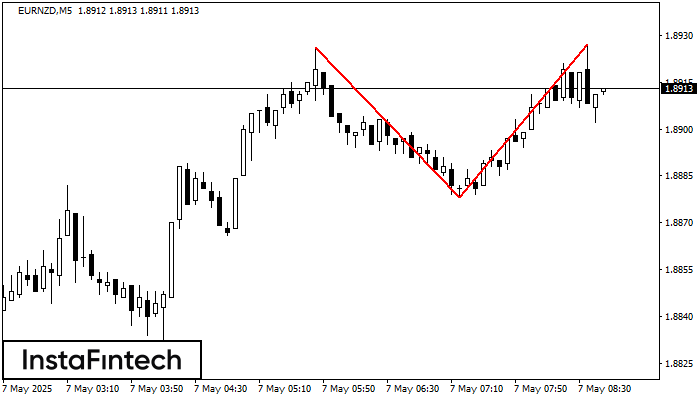
EURNZD M5 के चार्ट पर डबल टॉप रीवर्सल पैटर्न बना है। विशेषताएं: ऊपरी सीमा 1.8927; निचली सीमा 1.8878; पैटर्न की चौड़ाई 49 पॉइंट्स। संकेत: निचली सीमा के टूटने से 1.8863
M5 और M15 समय सीमा में अधिक फाल्स एंट्री पॉइंट्स हो सकते हैं।
Open chart in a new window


