GBP/USD
Analysis:
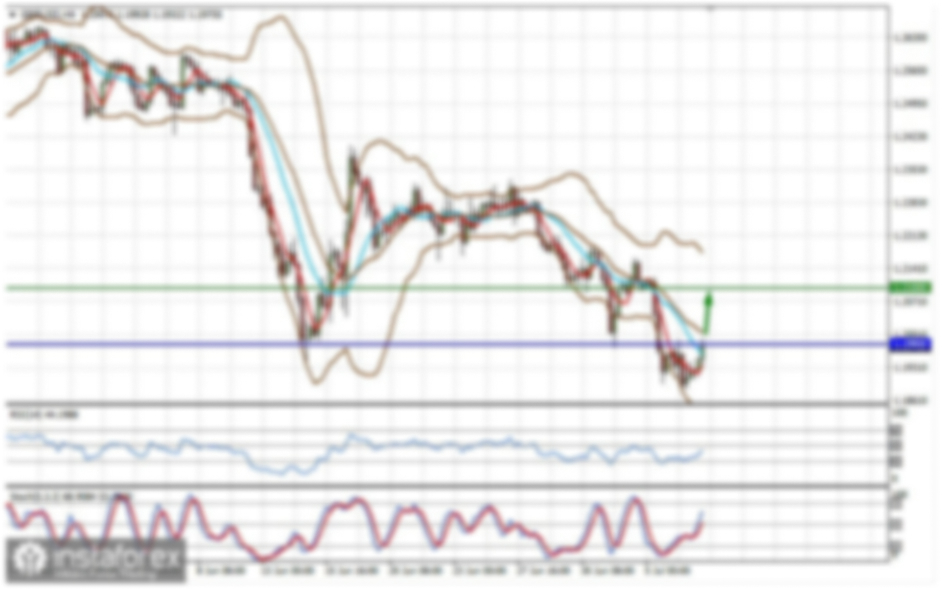
Since April, the primary direction of the British pound's movement has been set by an upward trend. Since mid-May, the price has been forming a (B) correction in the shape of a flat, which remains incomplete. The quotes have reached the lower boundary of the intermediate resistance zone of the higher time frame.
Forecast:
The decline is expected to end at the beginning of the upcoming week, with possible pressure on the resistance zone followed by sideways movement. Towards the weekend, there is an increased likelihood of a trend reversal and resumption of price growth up to the resistance boundaries.
Potential Reversal Zones:
- Resistance: 1.2830/1.2880
- Support: 1.2670/1.2620
Recommendations:
- Sales: Trades have low potential and may be risky.
- Purchases: These can be used in trading after verified reversal signals appear near the support zone.
AUD/USD
Analysis:
Within the dominant upward wave of the Australian dollar's major chart, the currently unfinished downward wave structure from May 16 serves as a correction. The wave structure appears complete at the time of analysis. The quotes are moving within the potential reversal zone of the daily scale.
Forecast:
After likely pressure on the support zone in the coming days, expect sideways movement, followed by a reversal and price growth up to the resistance zone boundaries. The highest volatility is expected towards the end of the week.
Potential Reversal Zones:
- Resistance: 0.6710/0.6760
- Support: 0.6570/0.6520
Recommendations:
- Sales: The potential for such trades is exhausted.
- Purchases: These can be used for short-term trades after reversal signals appear.
USD/CHF
Analysis:
The unfinished wave of the Swiss franc's major chart has been rising since the end of December last year. Since early May, quotes have formed a downward retracement from the lower boundary of a strong potential reversal zone, which is still incomplete. Its potential does not exceed the correction level.
Forecast:
In the coming days, there is a high probability of an upward retracement towards the resistance zone. Breaking the upper boundary of this zone is unlikely. Expect a resumption of price decline in the second half of the week. Volatility may increase with the release of important economic data.
Potential Reversal Zones:
- Resistance: 0.9020/0.9070
- Support: 0.8790/0.8740
Recommendations:
- Purchases: Have low potential; it's wiser to reduce the lot size.
- Sales: This can be used in trading when corresponding reversal signals appear near the resistance zone.
EUR/JPY
Analysis:
The fluctuations of the euro/yen pair fit within the upward wave pattern that began in December last year. Since late April, the price has formed a corrective shifting plane. At the time of analysis, its structure still needs to be completed. In the past two weeks, the price has formed a flat corridor with two price figures.
Forecast:
At the beginning of the week, expect pressure on the support zone, with a brief breach of its lower boundary possible. Afterward, a trend reversal can be expected, with price growth up to the calculated resistance boundaries.
Potential Reversal Zones:
- Resistance: 171.50/172.00
- Support: 169.00/168.50
Recommendations:
- Sales: Not advisable for the upcoming week.
- Purchases: These can be used in trading after confirmed reversal signals appear near the support zone.
EUR/GBP
Analysis:
The bearish wave that started last summer continues to form on the euro/pound cross chart, primarily within a sideways plane. The wave structure lacks a final (C) part. The price has broken through the lower boundary of a strong support zone, opening the way for further decline.
Forecast:
After a possible upward bounce at the beginning of next week, expect a gradual decline in the cross quotes to the calculated support zone levels. The second half of the week is expected to be the most volatile.
Potential Reversal Zones:
- Resistance: 0.8500/0.8550
- Support: 0.8300/0.8250
Recommendations:
- Purchases: Carry high risk and may be unprofitable.
- Sales: This can be used for trading after confirmed signals appear near the resistance zone.
US Dollar Index
Analysis:
Within the dominant bullish trend since March this year, the counter-correction on the dollar index chart is nearing completion. The upward wave that started on June 4, fueled by the strong support of the weekly time frame, has reversal potential. If confirmed, the short-term trend of the index will switch to an upward trend.
Forecast:
In the first half of the upcoming week, expect sideways movement for the index, with a possible downward vector. Towards the end of the week, anticipate a trend reversal and resumption of price growth from the support zone. The calculated resistance zone indicates the most likely upper boundary of the index's weekly fluctuations.
Potential Reversal Zones:
- Resistance: 105.40/105.60
- Support: 104.50/104.30
Recommendations:
- The period of short-term weakening of the US dollar is nearing its end. The optimal strategy for the upcoming week, after reversal signals appear on the chart, is to focus on selling national currencies in major pairs.
Notes:
In simplified wave analysis (SWA), all waves consist of three parts (A-B-C). The last incomplete wave is analyzed on each time frame. Expected movements are shown with dotted lines.
Attention: The wave algorithm does not account for the duration of instrument movements over time!