Stay
Stay 


Patterns are graphical models which are formed in the chart by the price. According to one of the technical analysis postulates, history (price movement) repeats itself. It means that the price movements are often similar in the same situations which makes it possible to predict the further development of the situation with a high probability.
Relevant patterns by InstaForex is an easy-to-use service which allows you to be aware of latest changes in the market and react to clues from the market in time. In our service you will always find the latest and most relevant patterns on any pair and any timeframe.
was formed on 27.04 at 19:30:44 (UTC+0)
signal strength 3 of 5
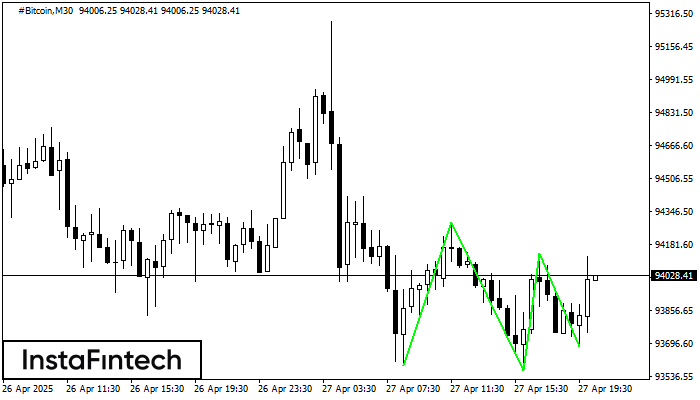
The Triple Bottom pattern has formed on the chart of #Bitcoin M30. Features of the pattern: The lower line of the pattern has coordinates 94291.97 with the upper limit 94291.97/94136.56, the projection of the width is 70503 points. The formation of the Triple Bottom pattern most likely indicates a change in the trend from downward to upward. This means that in the event of a breakdown of the resistance level 93586.94, the price is most likely to continue the upward movement.
See Also
- All
- Double Top
- Flag
- Head and Shoulders
- Pennant
- Rectangle
- Triangle
- Triple top
- All
- #AAPL
- #AMZN
- #EBAY
- #FB
- #GOOG
- #INTC
- #KO
- #MA
- #MCD
- #MSFT
- #NTDOY
- #PEP
- #TSLA
- #TWTR
- AUDCAD
- AUDCHF
- AUDJPY
- AUDUSD
- EURCAD
- EURCHF
- EURGBP
- EURJPY
- EURNZD
- EURRUB
- EURUSD
- GBPAUD
- GBPCHF
- GBPJPY
- GBPUSD
- GOLD
- NZDCAD
- NZDCHF
- NZDJPY
- NZDUSD
- SILVER
- USDCAD
- USDCHF
- USDJPY
- USDRUB
- All
- M5
- M15
- M30
- H1
- D1
- All
- Buy
- Sale
- All
- 1
- 2
- 3
- 4
- 5

Podle grafu M5 vytvořil #MCD vzor zvaný Obrácená hlava a ramena. Hlava se nachází na úrovni 307.79, zatímco střední linie krku se nachází na úrovni 308.99/309.18. Vytvoření vzoru Obrácená hlava
Časové rámce M5 a M15 mohou mít více falešných vstupních bodů.
Open chart in a new window
Podle grafu M5 vytvořil #NTDOY vzor Medvědí symetrický trojúhelník. Popis: Spodní hranice je 20.47/20.60 a horní hranice je 20.74/20.60. Šířka vzoru je podle grafu -27 pipů. Vytvoření vzoru Medvědí symetrický
Časové rámce M5 a M15 mohou mít více falešných vstupních bodů.
Open chart in a new window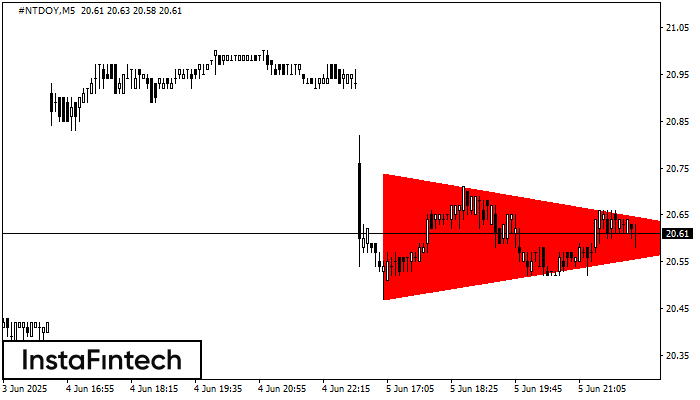
Podle grafu M5 vytvořil #NTDOY vzor Medvědí symetrický trojúhelník. Obchodní doporučení: Průlom spodní hranice 20.47 pravděpodobně podpoří pokračování sestupného trendu
Časové rámce M5 a M15 mohou mít více falešných vstupních bodů.
Open chart in a new window