


signal strength 2 of 5
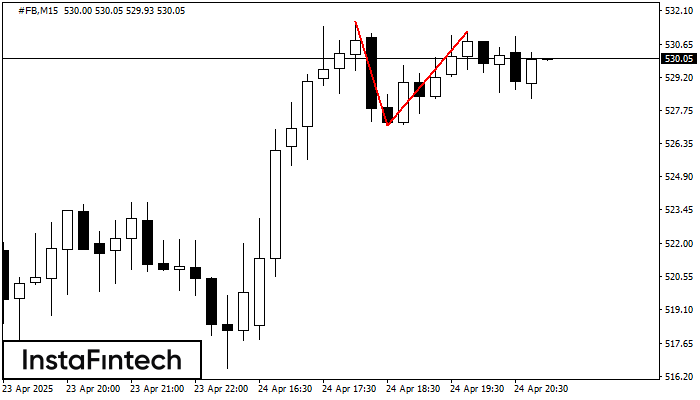
On the chart of #FB M15 the Double Top reversal pattern has been formed. Characteristics: the upper boundary 531.20; the lower boundary 527.14; the width of the pattern 406 points. The signal: a break of the lower boundary will cause continuation of the downward trend targeting the 526.91 level.
The M5 and M15 time frames may have more false entry points.
- All
- Double Top
- Flag
- Head and Shoulders
- Pennant
- Rectangle
- Triangle
- Triple top
- All
- #AAPL
- #AMZN
- #Bitcoin
- #EBAY
- #FB
- #GOOG
- #INTC
- #KO
- #MA
- #MCD
- #MSFT
- #NTDOY
- #PEP
- #TSLA
- #TWTR
- AUDCAD
- AUDCHF
- AUDJPY
- AUDUSD
- EURCAD
- EURCHF
- EURGBP
- EURJPY
- EURNZD
- EURRUB
- EURUSD
- GBPAUD
- GBPCHF
- GBPJPY
- GBPUSD
- GOLD
- NZDCAD
- NZDCHF
- NZDJPY
- NZDUSD
- SILVER
- USDCAD
- USDCHF
- USDJPY
- USDRUB
- All
- M5
- M15
- M30
- H1
- D1
- All
- Buy
- Sale
- All
- 1
- 2
- 3
- 4
- 5
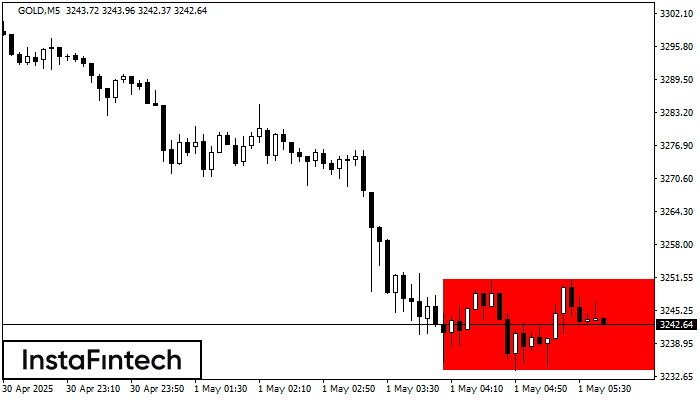
According to the chart of M5, GOLD formed the Bearish Rectangle. The pattern indicates a trend continuation. The upper border is 3251.29, the lower border is 3233.91. The signal means
The M5 and M15 time frames may have more false entry points.
Open chart in a new window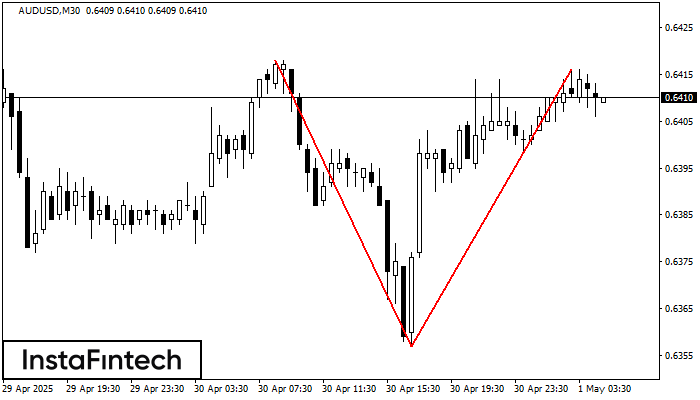
The Double Top reversal pattern has been formed on AUDUSD M30. Characteristics: the upper boundary 0.6418; the lower boundary 0.6357; the width of the pattern is 59 points. Sell trades
Open chart in a new window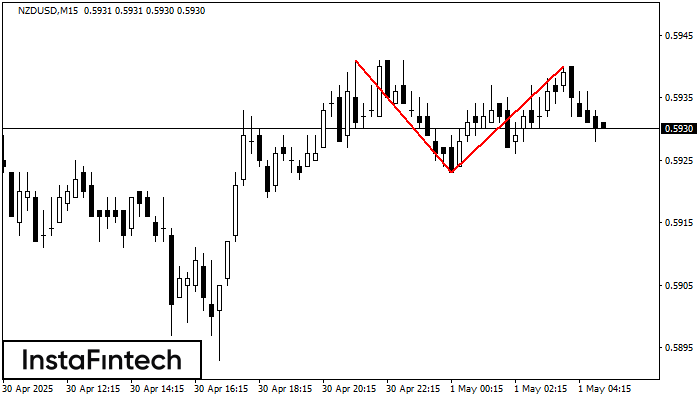
The Double Top pattern has been formed on NZDUSD M15. It signals that the trend has been changed from upwards to downwards. Probably, if the base of the pattern 0.5923
The M5 and M15 time frames may have more false entry points.
Open chart in a new window


