

signal strength 1 of 5

According to the chart of M5, #Bitcoin formed the Bullish Symmetrical Triangle pattern. Description: This is the pattern of a trend continuation. 83376.14 and 82331.42 are the coordinates of the upper and lower borders respectively. The pattern width is measured on the chart at 104472 pips. Outlook: If the upper border 83376.14 is broken, the price is likely to continue its move by 82907.57.
The M5 and M15 time frames may have more false entry points.
- All
- Double Top
- Flag
- Head and Shoulders
- Pennant
- Rectangle
- Triangle
- Triple top
- All
- #AAPL
- #AMZN
- #Bitcoin
- #EBAY
- #FB
- #GOOG
- #INTC
- #KO
- #MA
- #MCD
- #MSFT
- #NTDOY
- #PEP
- #TSLA
- #TWTR
- AUDCAD
- AUDCHF
- AUDJPY
- AUDUSD
- EURCAD
- EURCHF
- EURGBP
- EURJPY
- EURNZD
- EURRUB
- EURUSD
- GBPAUD
- GBPCHF
- GBPJPY
- GBPUSD
- GOLD
- NZDCAD
- NZDCHF
- NZDJPY
- NZDUSD
- SILVER
- USDCAD
- USDCHF
- USDJPY
- USDRUB
- All
- M5
- M15
- M30
- H1
- D1
- All
- Buy
- Sale
- All
- 1
- 2
- 3
- 4
- 5
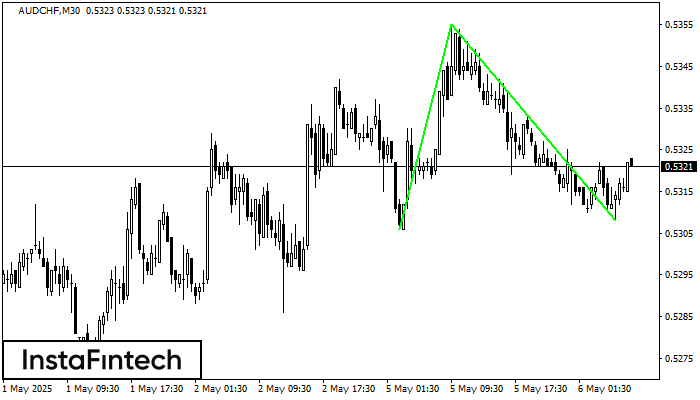
The Double Bottom pattern has been formed on AUDCHF M30. This formation signals a reversal of the trend from downwards to upwards. The signal is that a buy trade should
Open chart in a new window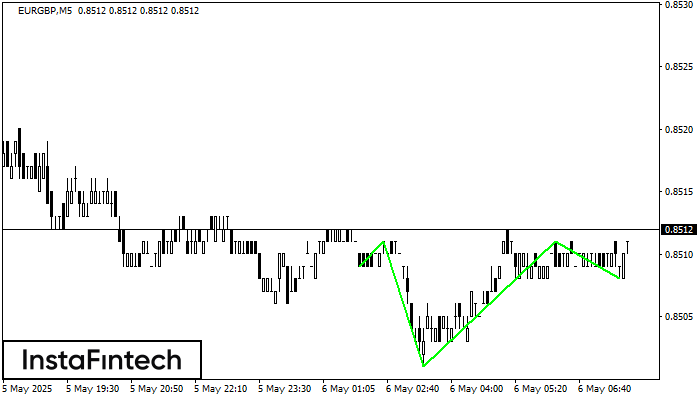
According to the chart of M5, EURGBP formed the Inverse Head and Shoulder pattern. The Head’s top is set at 0.8511 while the median line of the Neck is found
The M5 and M15 time frames may have more false entry points.
Open chart in a new window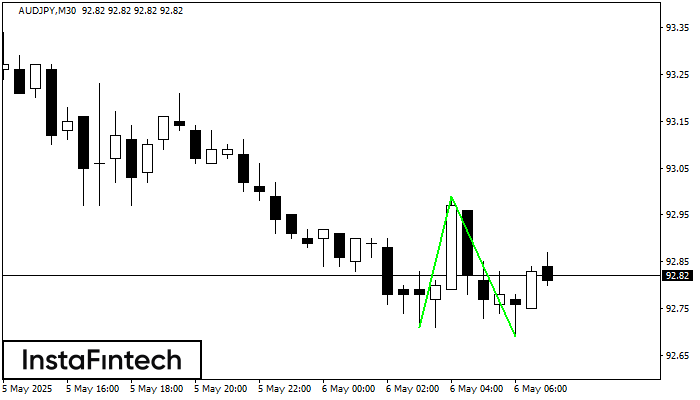
The Double Bottom pattern has been formed on AUDJPY M30. This formation signals a reversal of the trend from downwards to upwards. The signal is that a buy trade should
Open chart in a new window


