


signal strength 1 of 5

The Bearish Flag pattern has been formed on the chart #INTC M5. Therefore, the downwards trend is likely to continue in the nearest term. As soon as the price breaks below the low at 24.13, traders should enter the market.
The M5 and M15 time frames may have more false entry points.
See Also
- All
- Double Top
- Flag
- Head and Shoulders
- Pennant
- Rectangle
- Triangle
- Triple top
- All
- #AAPL
- #AMZN
- #Bitcoin
- #EBAY
- #FB
- #GOOG
- #INTC
- #KO
- #MA
- #MCD
- #MSFT
- #NTDOY
- #PEP
- #TSLA
- #TWTR
- AUDCAD
- AUDCHF
- AUDJPY
- AUDUSD
- EURCAD
- EURCHF
- EURGBP
- EURJPY
- EURNZD
- EURRUB
- EURUSD
- GBPAUD
- GBPCHF
- GBPJPY
- GBPUSD
- GOLD
- NZDCAD
- NZDCHF
- NZDJPY
- NZDUSD
- SILVER
- USDCAD
- USDCHF
- USDJPY
- USDRUB
- All
- M5
- M15
- M30
- H1
- D1
- All
- Buy
- Sale
- All
- 1
- 2
- 3
- 4
- 5
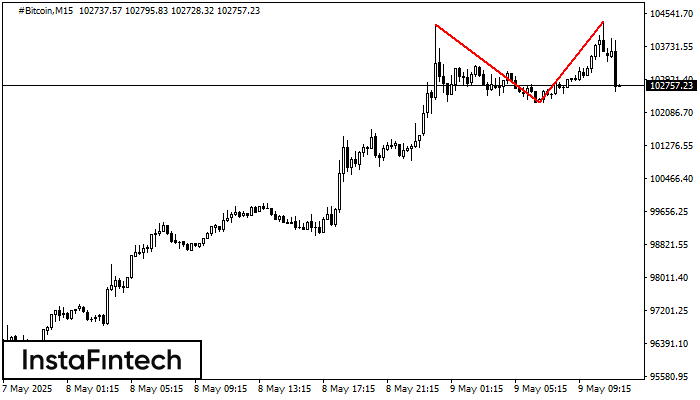
รูปแบบการย้อนตัว รูปแบบกราฟจุดสองยอด (Double Top) ได้ถูกสร้างขึ้นมาใน #Bitcoin M15 คุณลักษณะ: ขอบเขตด้านบน 104269.79; ขอบเขตด้านล่าง 102332.80; ความกว้างของกราฟรูปแบบนี้คือ 201342 จุด
ขอบเตระยะเวลาใน M5 และ M15 อาจจะมีตำแหน่งการเข้าใช้งานที่ผิดพลาดมากยิ่งขึ้น
Open chart in a new windowwas formed on 09.05 at 10:00:01 (UTC+0)
signal strength 3 of 5
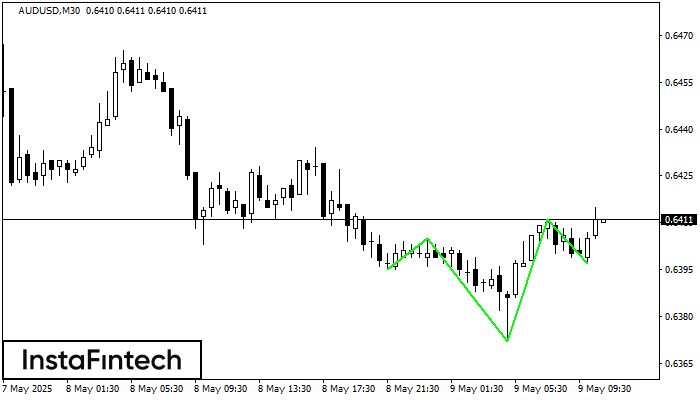
อ้างอิงจาก M30, AUDUSD กำลังก่อรูปแบบทางเทคนิคขึ้นมา รูปแบบกราฟหัวและหัวไหล่แบบกลับหัว (Inverse Head and Shoulder) ในกรณีที่มีการเคลื่อนตัวทะลุผ่านตำแหน่งคอ 0.6405/0.6411 ออกไป ตราสารก็อาจจะเคลื่อนตัวไปยัง 0.6441
Open chart in a new windowwas formed on 09.05 at 09:45:18 (UTC+0)
signal strength 2 of 5
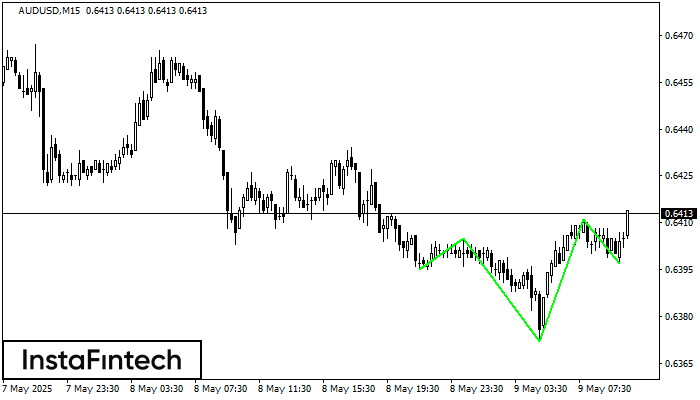
อ้างอิงจาก M15, AUDUSD กำลังก่อรูปแบบทางเทคนิคขึ้นมา รูปแบบกราฟหัวและหัวไหล่แบบกลับหัว (Inverse Head and Shoulder) ในกรณีที่มีการเคลื่อนตัวทะลุผ่านตำแหน่งคอ 0.6405/0.6411 ออกไป ตราสารก็อาจจะเคลื่อนตัวไปยัง 0.6434
ขอบเตระยะเวลาใน M5 และ M15 อาจจะมีตำแหน่งการเข้าใช้งานที่ผิดพลาดมากยิ่งขึ้น
Open chart in a new window


