

сила сигнала 1 из 5
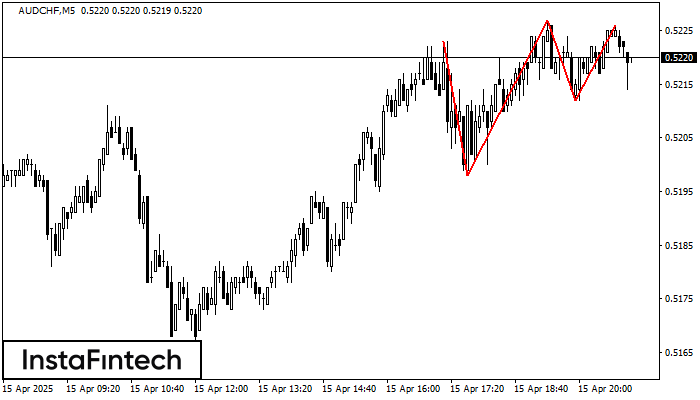
На графике AUDCHF M5 образовалась фигура «Тройная вершина», которая сигнализирует об изменении тенденции. Возможный сценарий: После формирования третьей вершины котировка постарается пробить нижнюю границу 0.5212, где трейдеру и стоило бы открывать торговую позицию на продажу. Тейк Профит - это и есть проекция ширины фигуры, которая составляет 15 пунктов.
Таймфреймы М5 и М15 могут иметь больше ложных точек входа.
- Все
- Вымпел
- Голова и плечи
- Двойная вершина
- Прямоугольник
- Треугольник
- Тройная вершина
- Флаг
- Все
- #AAPL
- #AMZN
- #Bitcoin
- #EBAY
- #FB
- #GOOG
- #INTC
- #KO
- #MA
- #MCD
- #MSFT
- #NTDOY
- #PEP
- #TSLA
- #TWTR
- AUDCAD
- AUDCHF
- AUDJPY
- AUDUSD
- EURCAD
- EURCHF
- EURGBP
- EURJPY
- EURNZD
- EURRUB
- EURUSD
- GBPAUD
- GBPCHF
- GBPJPY
- GBPUSD
- GOLD
- NZDCAD
- NZDCHF
- NZDJPY
- NZDUSD
- SILVER
- USDCAD
- USDCHF
- USDJPY
- USDRUB
- Все
- M5
- M15
- M30
- H1
- D1
- Все
- Покупка
- Продажа
- Все
- 1
- 2
- 3
- 4
- 5
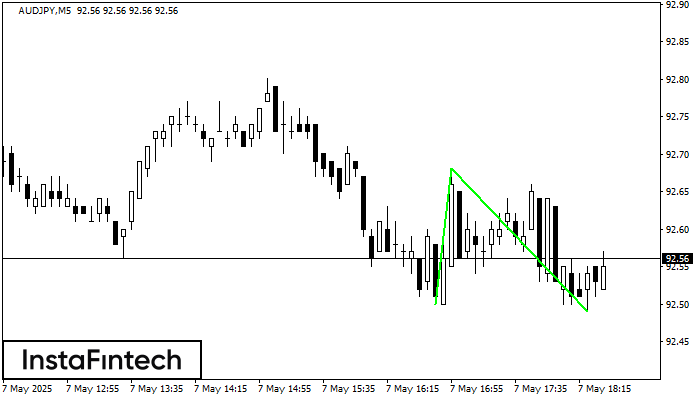
The Double Bottom pattern has been formed on AUDJPY M5. This formation signals a reversal of the trend from downwards to upwards. The signal is that a buy trade should
The M5 and M15 time frames may have more false entry points.
Open chart in a new window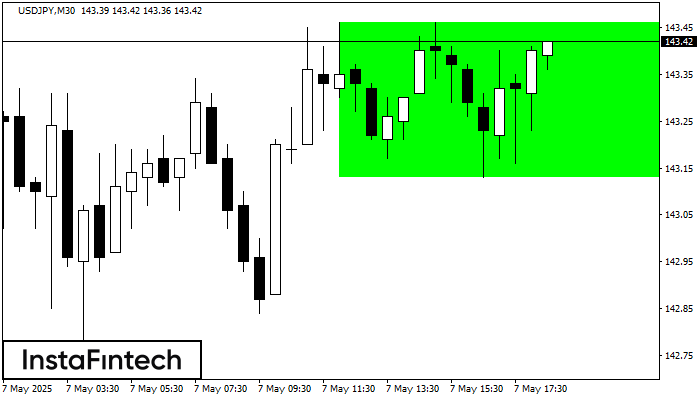
According to the chart of M30, USDJPY formed the Bullish Rectangle. The pattern indicates a trend continuation. The upper border is 143.46, the lower border is 143.13. The signal means
Open chart in a new window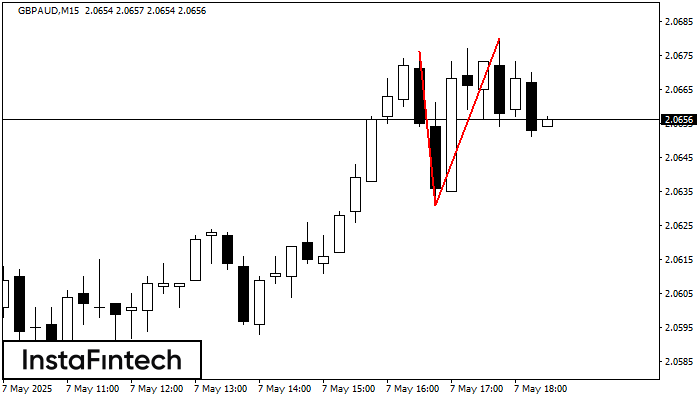
On the chart of GBPAUD M15 the Double Top reversal pattern has been formed. Characteristics: the upper boundary 2.0680; the lower boundary 2.0631; the width of the pattern 49 points
The M5 and M15 time frames may have more false entry points.
Open chart in a new window


