

signal strength 2 of 5
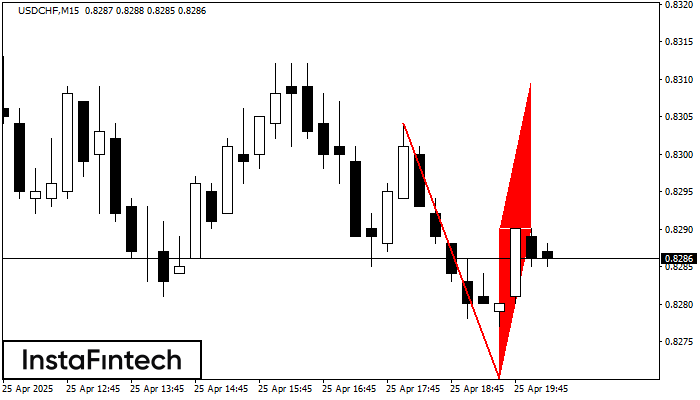
The Bearish Flag pattern has been formed on the chart USDCHF M15 which signals that the downward trend will continue. If the price breaks below the low at 0.8270, then it is most likely to move further downwards. The price will likely move by the number of points which equals the length of the flag pole (15 points).
The M5 and M15 time frames may have more false entry points.
See Also
- All
- Double Top
- Flag
- Head and Shoulders
- Pennant
- Rectangle
- Triangle
- Triple top
- All
- #AAPL
- #AMZN
- #Bitcoin
- #EBAY
- #FB
- #GOOG
- #INTC
- #KO
- #MA
- #MCD
- #MSFT
- #NTDOY
- #PEP
- #TSLA
- #TWTR
- AUDCAD
- AUDCHF
- AUDJPY
- AUDUSD
- EURCAD
- EURCHF
- EURGBP
- EURJPY
- EURNZD
- EURRUB
- EURUSD
- GBPAUD
- GBPCHF
- GBPJPY
- GBPUSD
- GOLD
- NZDCAD
- NZDCHF
- NZDJPY
- NZDUSD
- SILVER
- USDCAD
- USDCHF
- USDJPY
- USDRUB
- All
- M5
- M15
- M30
- H1
- D1
- All
- Buy
- Sale
- All
- 1
- 2
- 3
- 4
- 5
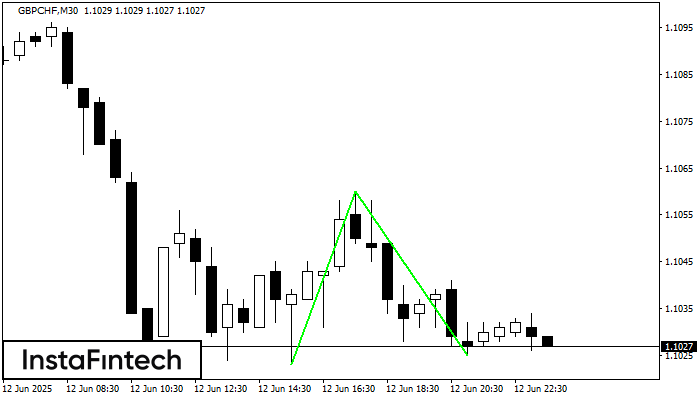
O padrão Fundo duplo foi formado em GBPCHF M30. Características: o nível de suporte 1.1023; o nível de resistência 1.1060; a largura do padrão 37 pontos. Se o nível
Open chart in a new window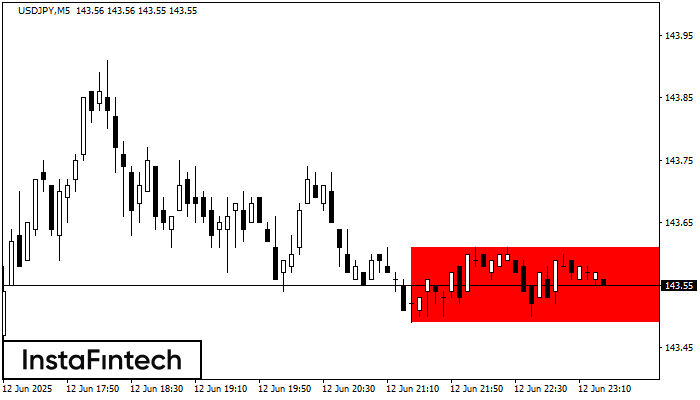
De acordo com o gráfico de M5, USDJPY formou Retângulo de baixa. O padrão indica uma continuação da tendência. O limite superior é 143.61, o limite inferior é 143.49
Os intervalos M5 e M15 podem ter mais pontos de entrada falsos.
Open chart in a new window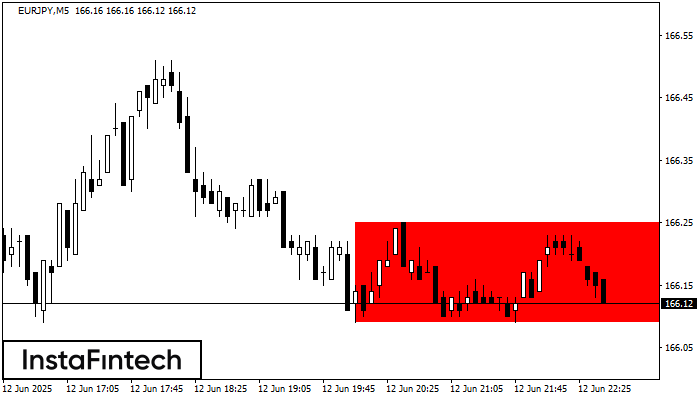
De acordo com o gráfico de M5, EURJPY formou Retângulo de baixa. O padrão indica uma continuação da tendência. O limite superior é 166.25, o limite inferior é 166.09
Os intervalos M5 e M15 podem ter mais pontos de entrada falsos.
Open chart in a new window


