

signal strength 1 of 5

According to the chart of M5, EURJPY formed the Bearish Symmetrical Triangle pattern. Description: The lower border is 161.15/161.86 and upper border is 162.37/161.86. The pattern width is measured on the chart at -122 pips. The formation of the Bearish Symmetrical Triangle pattern evidently signals a continuation of the downward trend. In other words, if the scenario comes true and EURJPY breaches the lower border, the price could continue its move toward 161.71.
The M5 and M15 time frames may have more false entry points.
- All
- Double Top
- Flag
- Head and Shoulders
- Pennant
- Rectangle
- Triangle
- Triple top
- All
- #AAPL
- #AMZN
- #Bitcoin
- #EBAY
- #FB
- #GOOG
- #INTC
- #KO
- #MA
- #MCD
- #MSFT
- #NTDOY
- #PEP
- #TSLA
- #TWTR
- AUDCAD
- AUDCHF
- AUDJPY
- AUDUSD
- EURCAD
- EURCHF
- EURGBP
- EURJPY
- EURNZD
- EURRUB
- EURUSD
- GBPAUD
- GBPCHF
- GBPJPY
- GBPUSD
- GOLD
- NZDCAD
- NZDCHF
- NZDJPY
- NZDUSD
- SILVER
- USDCAD
- USDCHF
- USDJPY
- USDRUB
- All
- M5
- M15
- M30
- H1
- D1
- All
- Buy
- Sale
- All
- 1
- 2
- 3
- 4
- 5
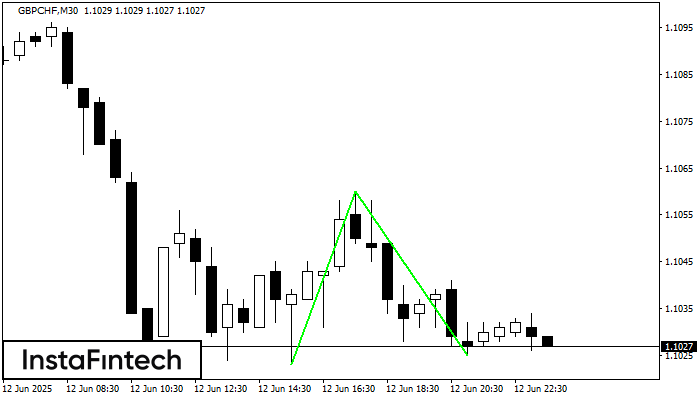
O padrão Fundo duplo foi formado em GBPCHF M30. Características: o nível de suporte 1.1023; o nível de resistência 1.1060; a largura do padrão 37 pontos. Se o nível
Open chart in a new window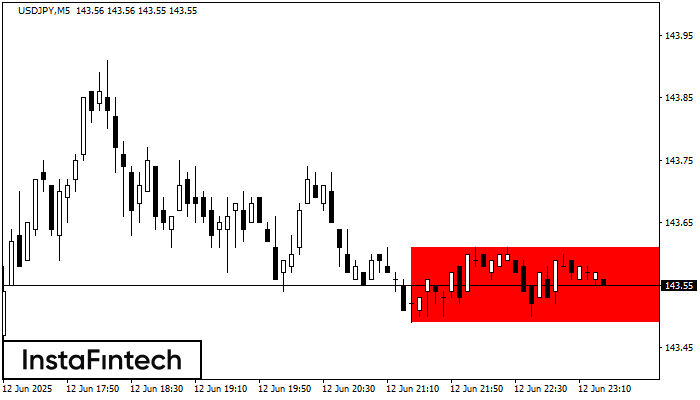
De acordo com o gráfico de M5, USDJPY formou Retângulo de baixa. O padrão indica uma continuação da tendência. O limite superior é 143.61, o limite inferior é 143.49
Os intervalos M5 e M15 podem ter mais pontos de entrada falsos.
Open chart in a new window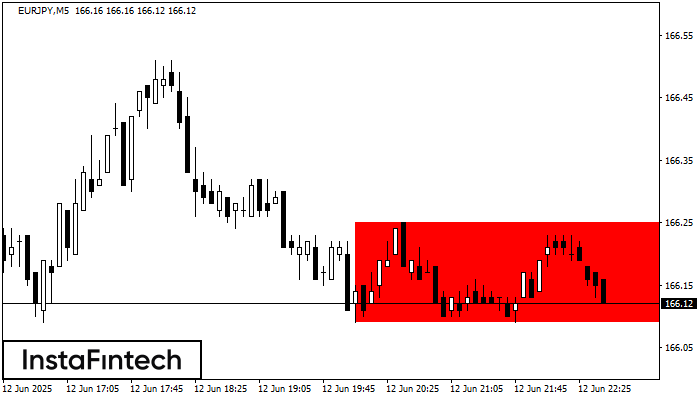
De acordo com o gráfico de M5, EURJPY formou Retângulo de baixa. O padrão indica uma continuação da tendência. O limite superior é 166.25, o limite inferior é 166.09
Os intervalos M5 e M15 podem ter mais pontos de entrada falsos.
Open chart in a new window


