


signal strength 1 of 5

The Bearish Flag pattern has been formed on the chart #INTC M5. Therefore, the downwards trend is likely to continue in the nearest term. As soon as the price breaks below the low at 24.13, traders should enter the market.
The M5 and M15 time frames may have more false entry points.
See Also
- All
- Double Top
- Flag
- Head and Shoulders
- Pennant
- Rectangle
- Triangle
- Triple top
- All
- #AAPL
- #AMZN
- #Bitcoin
- #EBAY
- #FB
- #GOOG
- #INTC
- #KO
- #MA
- #MCD
- #MSFT
- #NTDOY
- #PEP
- #TSLA
- #TWTR
- AUDCAD
- AUDCHF
- AUDJPY
- AUDUSD
- EURCAD
- EURCHF
- EURGBP
- EURJPY
- EURNZD
- EURRUB
- EURUSD
- GBPAUD
- GBPCHF
- GBPJPY
- GBPUSD
- GOLD
- NZDCAD
- NZDCHF
- NZDJPY
- NZDUSD
- SILVER
- USDCAD
- USDCHF
- USDJPY
- USDRUB
- All
- M5
- M15
- M30
- H1
- D1
- All
- Buy
- Sale
- All
- 1
- 2
- 3
- 4
- 5
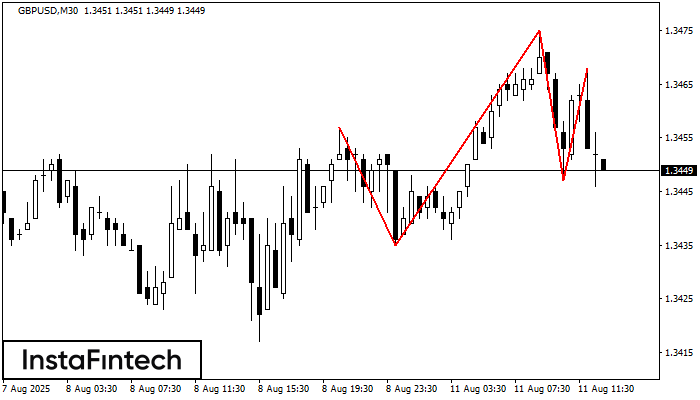
The technical pattern called Head and Shoulders has appeared on the chart of GBPUSD M30. There are weighty reasons to suggest that the price will surpass the Neckline 1.3435/1.3447 after
Open chart in a new window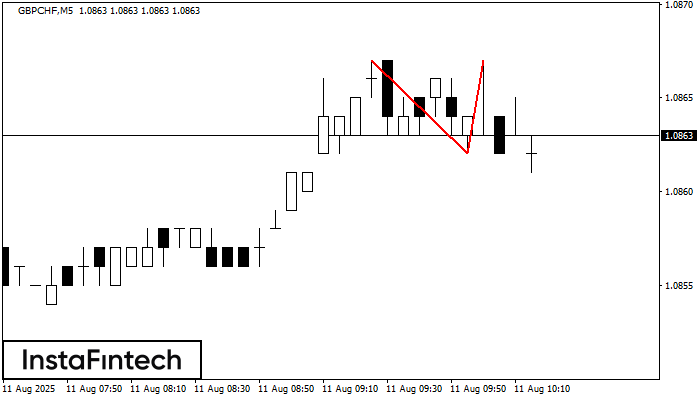
The Double Top reversal pattern has been formed on GBPCHF M5. Characteristics: the upper boundary 1.0867; the lower boundary 1.0862; the width of the pattern is 5 points. Sell trades
The M5 and M15 time frames may have more false entry points.
Open chart in a new window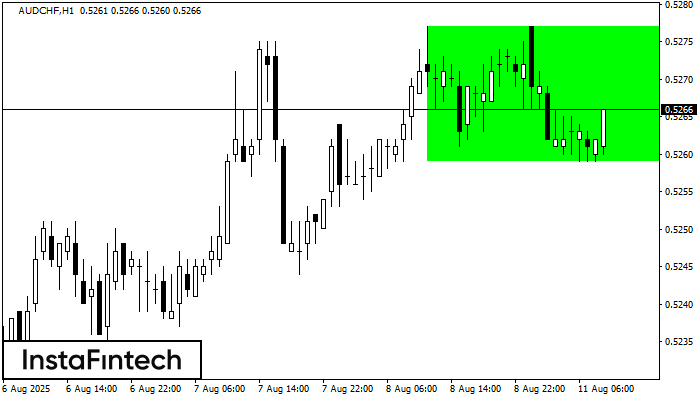
According to the chart of H1, AUDCHF formed the Bullish Rectangle. This type of a pattern indicates a trend continuation. It consists of two levels: resistance 0.5277 and support 0.5259
Open chart in a new window


