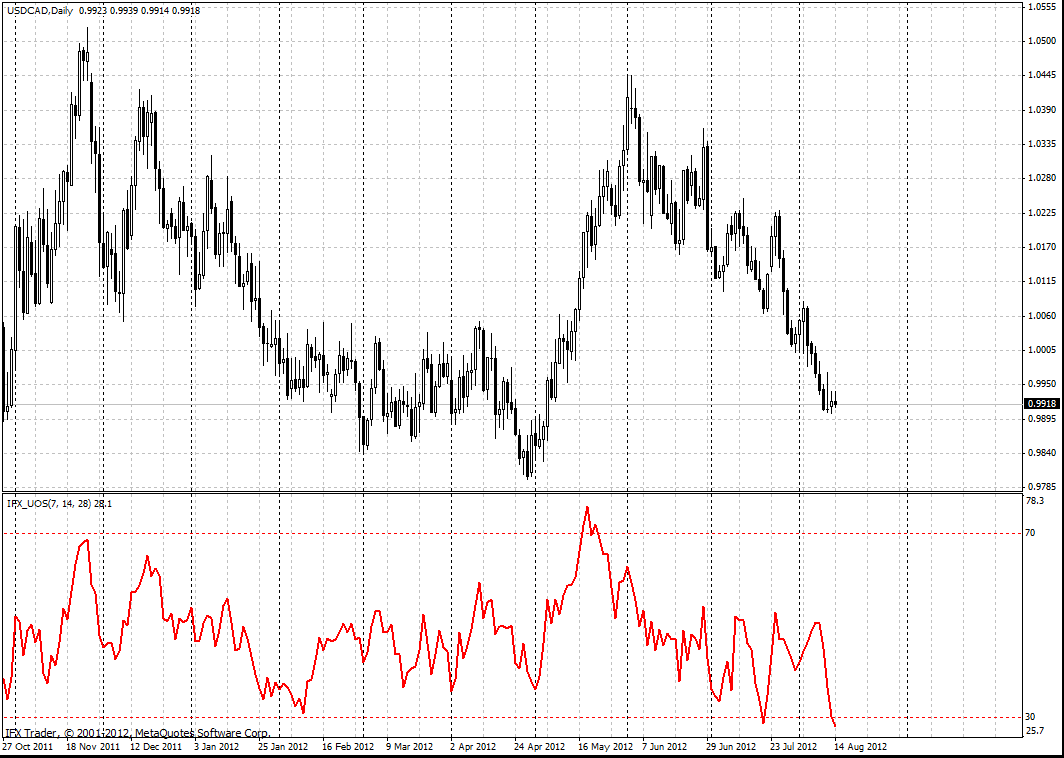
Ultimate Oscillator was developed by Larry Williams in 1985 and described in Technical Analysis of Stocks and Commodities Magazine. This indicator can be related to classical oscillators for technical analysis. However, Ultimate Oscillator surpasses other indicators by the data analyzed and the strength of its signals. It uses weighted average of three different time periods.
Calculation
Determine the current True Low, TL. TL - is the lowest current minimum or the previous closing price.
TL (i) = MIN (LOW (i) || CLOSE (i - 1))
Calculate current Buying Pressure, BP is equal to the difference between the closing price and the True Low.
BP (i) = CLOSE (i) - TL (i)
Get the True Range, TR. This is the biggest difference of the current low and high; or current high and the previous closing price; previous closing price and the current low.
TR (i) = MAX (HIGH (i) - LOW (i) || HIGH (i) - CLOSE (i - 1) || CLOSE (i - 1) - LOW (i))
Count the sum of BP indicators for all time periods
BPSUM (N) = SUM (BP (i), i)
Compute the sum of TR indicators for all three time periods
TRSUM (N) = SUM (TR (i), i)
Identify the Raw Ultimate Oscillator, RawUO
RawUO = 4 * (BPSUM (1) / TRSUM (1)) + 2 * (BPSUM (2) / TRSUM (2)) + (BPSUM (3) / TRSUM (3))
Calculate Ultimate Oscillator, UO
UO = ( RawUO / (4 + 2 + 1)) * 100, where
MIN - minimum reading;
MAX - maximum reading;
|| - logical OR;
LOW (i) - lowest price of the current bar;
HIGH (i) - highest price of the current bar;
CLOSE (i) - closing price of the current bar;
CLOSE (i - 1) - closing price of the previous bar;
TL (i) - True Low;
BP (i) - Buying Pressure;
TR (i) - True Range;
BPSUM (N) - sum of BP readings for N period (N which is equal to 1 is i = 7 bars; when N = 2, i = 14 bars; when N = 3, i = 28 bars);
TRSUM (N) - sum of TR readings for N period (N which is equal to 1 is i = 7 bars; when N = 2, i = 14 bars; when N = 3, i = 28 bars);
RawUO - Raw Ultimate Oscillator reading;
UO - Ultimate Oscillator reading.
Trading Use
aking into account that Ultimate Oscillator is used for technical analysis and it fluctuates in the range from 0% to100%, the baseline of Ultimate Oscillator can be regarded as oversold/overbought indicator for the market. If the indicator demonstrates the reading above 70 level, the market is overbought and there will be a trend reversal soon. In case the indicator dropped below 30 level, it will be possible to observe prices growth soon.
It is necessary to consider so-called Gambler's Fallacy factor while using this kind of method based on Ultimate Oscillator (as well as any other technical oscillator).
Larry Williams suggested absolutely different approach when using this indicator, but it is very relevant for modern exchange markets now:
- if there is bearish divergence amid price growth and the indicator falls below 50 level, it is necessary to open short positions. In case the price sinks below 30 level, close short positions;
- if there is bullish convergence amid price drop and the indicator is above 50 level, open long positions. When the price overcomes 70 level, close long positions.

InstaForex Ultimate Oscillator Parameters
fastperiod = 7
middleperiod = 14
slowperiod = 28
fastK = 4
middleK = 2
slowK = 1


