

signal strength 2 of 5
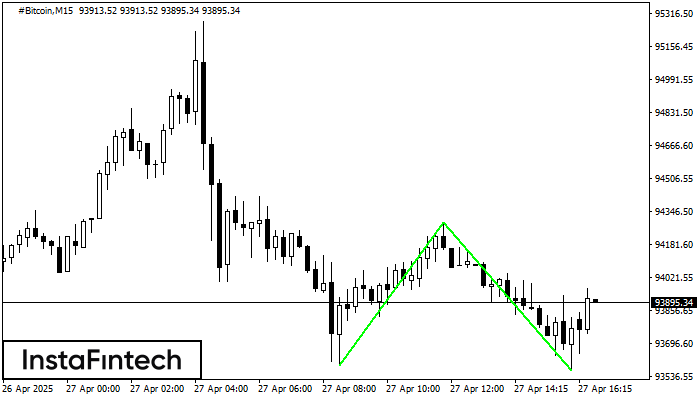
The Double Bottom pattern has been formed on #Bitcoin M15. This formation signals a reversal of the trend from downwards to upwards. The signal is that a buy trade should be opened after the upper boundary of the pattern 94291.97 is broken. The further movements will rely on the width of the current pattern 70503 points.
The M5 and M15 time frames may have more false entry points.
- All
- Double Top
- Flag
- Head and Shoulders
- Pennant
- Rectangle
- Triangle
- Triple top
- All
- #AAPL
- #AMZN
- #Bitcoin
- #EBAY
- #FB
- #GOOG
- #INTC
- #KO
- #MA
- #MCD
- #MSFT
- #NTDOY
- #PEP
- #TSLA
- #TWTR
- AUDCAD
- AUDCHF
- AUDJPY
- AUDUSD
- EURCAD
- EURCHF
- EURGBP
- EURJPY
- EURNZD
- EURRUB
- EURUSD
- GBPAUD
- GBPCHF
- GBPJPY
- GBPUSD
- GOLD
- NZDCAD
- NZDCHF
- NZDJPY
- NZDUSD
- SILVER
- USDCAD
- USDCHF
- USDJPY
- USDRUB
- All
- M5
- M15
- M30
- H1
- D1
- All
- Buy
- Sale
- All
- 1
- 2
- 3
- 4
- 5
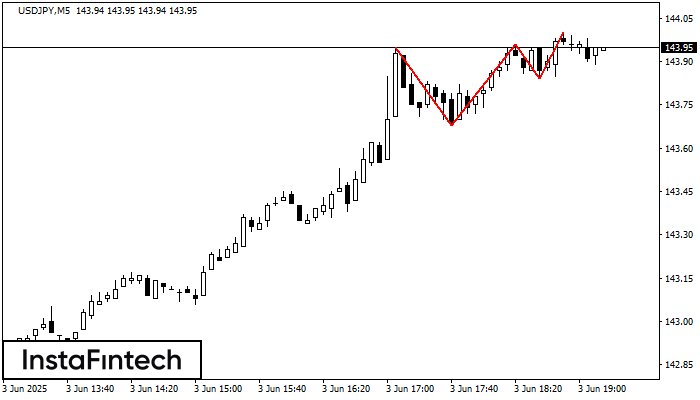
On the chart of the USDJPY M5 trading instrument, the Triple Top pattern that signals a trend change has formed. It is possible that after formation of the third peak
The M5 and M15 time frames may have more false entry points.
Open chart in a new window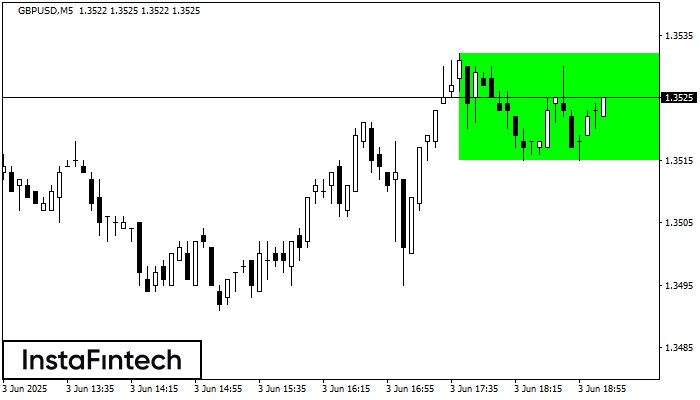
According to the chart of M5, GBPUSD formed the Bullish Rectangle. This type of a pattern indicates a trend continuation. It consists of two levels: resistance 1.3532 and support 1.3515
The M5 and M15 time frames may have more false entry points.
Open chart in a new window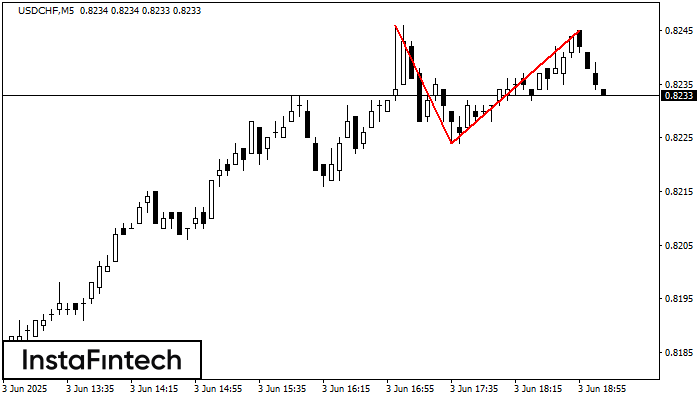
On the chart of USDCHF M5 the Double Top reversal pattern has been formed. Characteristics: the upper boundary 0.8245; the lower boundary 0.8224; the width of the pattern 21 points
The M5 and M15 time frames may have more false entry points.
Open chart in a new window


